Explore Azure Synapse Analytics
Azure Synapse Analytics provides a single, consolidated data analytics platform for end-to end data analytics. In this lab, you’ll explore various ways to ingest and explore data. This lab is designed as a high-level overview of the various core capabilities of Azure Synapse Analytics; which you’ll explore in more depth in later labs.
This lab will take approximately 60 minutes to complete.
Before you start
You’ll need an Azure subscription in which you have administrative-level access.
Provision an Azure Synapse Analytics workspace
An Azure Synapse Analytics workspace provides a central point for managing data and data processing runtimes. You can provision a workspace using the interactive interface in the Azure portal, or you can deploy a workspace and resources within it by using a script or template. In most production scenarios, it’s best to automate provisioning with scripts and templates so that you can incorporate resource deployment into a repeatable development and operations (DevOps) process.
In this exercise, you’ll use a combination of a PowerShell script and an ARM template to provision Azure Synapse Analytics.
- In a web browser, sign into the Azure portal at
https://portal.azure.com. -
Use the [>_] button to the right of the search bar at the top of the page to create a new Cloud Shell in the Azure portal, selecting a PowerShell environment and creating storage if prompted. The cloud shell provides a command line interface in a pane at the bottom of the Azure portal, as shown here:
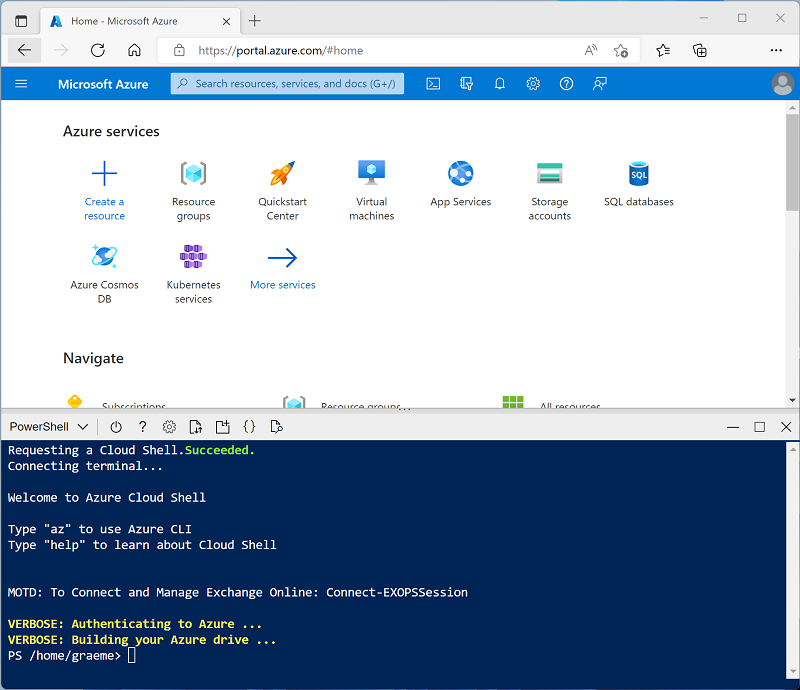
Note: If you have previously created a cloud shell that uses a Bash environment, use the the drop-down menu at the top left of the cloud shell pane to change it to PowerShell.
-
Note that you can resize the cloud shell by dragging the separator bar at the top of the pane, or by using the —, ◻, and X icons at the top right of the pane to minimize, maximize, and close the pane. For more information about using the Azure Cloud Shell, see the Azure Cloud Shell documentation.
-
In the PowerShell pane, enter the following commands to clone this repo:
rm -r dp-000 -f git clone https://github.com/MicrosoftLearning/mslearn-synapse dp-000 -
After the repo has been cloned, enter the following commands to change to the folder for this lab and run the setup.ps1 script it contains:
cd dp-000/Allfiles/Labs/01 ./setup.ps1 - If prompted, choose which subscription you want to use (this will only happen if you have access to multiple Azure subscriptions).
-
When prompted, enter a suitable password to be set for your Azure Synapse SQL pool.
Note: Be sure to remember this password!
- Wait for the script to complete - this typically takes around 20 minutes, but in some cases may take longer. While you are waiting, review the What is Azure Synapse Analytics? article in the Azure Synapse Analytics documentation.
Explore Synapse Studio
Synapse Studio is a web-based portal in which you can manage and work with the resources in your Azure Synapse Analytics workspace.
- When the setup script has finished running, in the Azure portal, go to the dp000-xxxxxxx resource group that it created, and notice that this resource group contains your Synapse workspace, a Storage account for your data lake, an Apache Spark pool, a Data Explorer pool, and a Dedicated SQL pool.
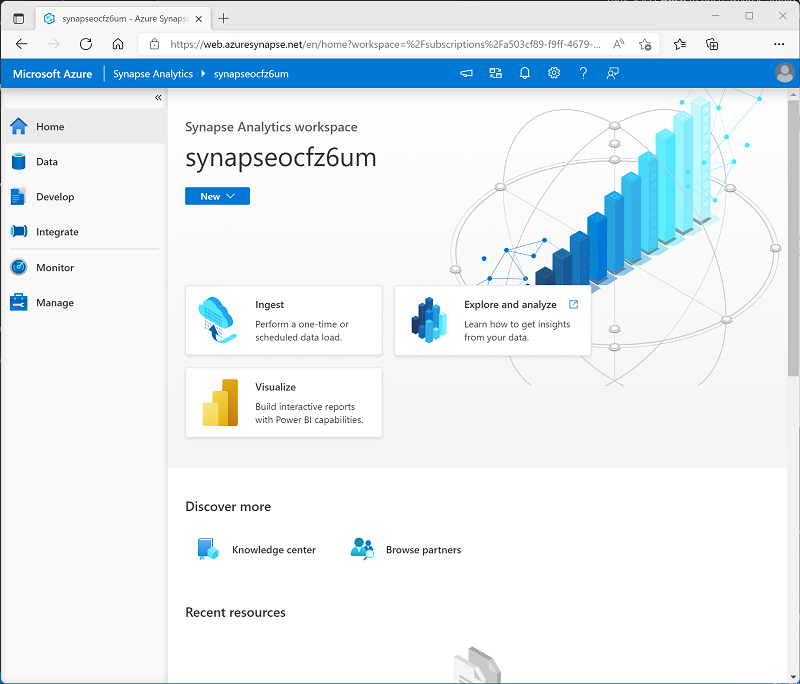
- Select your Synapse workspace, and in its Overview page, in the Open Synapse Studio card, select Open to open Synapse Studio in a new browser tab. Synapse Studio is a web-based interface that you can use to work with your Synapse Analytics workspace.
-
On the left side of Synapse Studio, use the ›› icon to expand the menu - this reveals the different pages within Synapse Studio that you’ll use to manage resources and perform data analytics tasks, as shown here:
- View the Data page, and note that there are two tabs containing data sources:
- A Workspace tab containing databases defined in the workspace (including dedicated SQL databases and Data Explorer databases)
- A Linked tab containing data sources that are linked to the workspace, including Azure Data Lake storage.
- View the Develop page, which is currently empty. This is where you can define scripts and other assets used to develop data processing solutions.
- View the Integrate page, which is also empty. You use this page to manage data ingestion and integration assets; such as pipelines to transfer and transform data between data sources.
- View the Monitor page. This is where you can observe data processing jobs as they run and view their history.
- View the Manage page. This is where you manage the pools, runtimes, and other assets used in your Azure Synapse workspace. View each of the tabs in the Analytics pools section and note that your workspace includes the following pools:
- SQL pools:
- Built-in: A serverless SQL pool that you can use on-demand to explore or process data in a data lake by using SQL commands.
- sqlxxxxxxx: A dedicated SQL pool that hosts a relational data warehouse database.
- Apache Spark pools:
- sparkxxxxxxx: that you can use on-demand to explore or process data in a data lake by using programming languages like Scala or Python.
- Data Explorer pools:
- adxxxxxxxx: A Data Explorer pool that you can use to analyze data by using Kusto Query Language (KQL).
- SQL pools:
Ingest data with a pipeline
One of the key tasks you can perform with Azure Synapse Analytics is to define pipelines that transfer (and if necessary, transform) data from a wide range of sources into your workspace for analysis.
Use the Copy Data task to create a pipeline
- In Synapse Studio, on the Home page, select Ingest to open the Copy Data tool
- In the Copy Data tool, on the Properties step, ensure that Built-in copy task and Run once now are selected, and click Next >.
- On the Source step, in the Dataset substep, select the following settings:
- Source type: All
- Connection: Create a new connection, and in the Linked service pane that appears, on the File tab, select HTTP. Then continue and create a connection to a data file using the following settings:
- Name: Products
- Description: Product list via HTTP
- Connect via integration runtime: AutoResolveIntegrationRuntime
- Base URL:
https://raw.githubusercontent.com/MicrosoftLearning/mslearn-synapse/master/Allfiles/Labs/01/adventureworks/products.csv - Server Certificate Validation: Enable
- Authentication type: Anonymous
- After creating the connection, on the Source data store page, ensure the following settings are selected, and then select Next >:
- Relative URL: Leave blank
- Request method: GET
- Additional headers: Leave blank
- Binary copy: Unselected
- Request timeout: Leave blank
- Max concurrent connections: Leave blank
- On the Source step, in the Configuration substep, select Preview data to see a preview of the product data your pipeline will ingest, then close the preview.
- After previewing the data, on the File format settings page, ensure the following settings are selected, and then select Next >:
- File format: DelimitedText
- Column delimiter: Comma (,)
- Row delimiter: Line feed (\n)
- First row as header: Selected
- Compression type: None
- On the Destination step, in the Dataset substep, select the following settings:
- Destination type: Azure Data Lake Storage Gen 2
- Connection: Select the existing connection to your data lake store (this was created for you when you created the workspace).
- After selecting the connection, on the Destination/Dataset step, ensure the following settings are selected, and then select Next >:
- Folder path: files/product_data
- File name: products.csv
- Copy behavior: None
- Max concurrent connections: Leave blank
- Block size (MB): Leave blank
- On the Destination step, in the Configuration substep, on the File format settings page, ensure that the following properties are selected. Then select Next >:
- File format: DelimitedText
- Column delimiter: Comma (,)
- Row delimiter: Line feed (\n)
- Add header to file: Selected
- Compression type: None
- Max rows per file: Leave blank
- File name prefix: Leave blank
- On the Settings step, enter the following settings and then click Next >:
- Task name: Copy products
- Task description Copy products data
- Fault tolerance: Leave blank
- Enable logging: Unselected
- Enable staging: Unselected
- On the Review and finish step, on the Review substep, read the summary and then click Next >.
- On the Deployment step, wait for the pipeline to be deployed and then click Finish.
- In Synapse Studio, select the Monitor page, and in the Pipeline runs tab, wait for the Copy products pipeline to complete with a status of Succeeded (you can use the ↻ Refresh button on the Pipeline runs page to refresh the status).
- View the Integrate page, and verify that it now contains a pipeline named Copy products.
View the ingested data
-
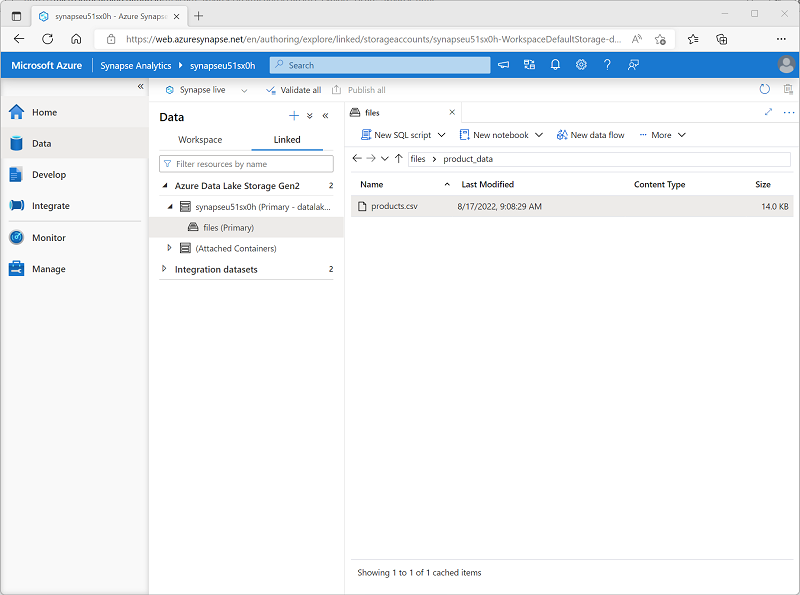
On the Data page, select the Linked tab and expand the Product Files hierarchy until you see the files file storage for your Synapse workspace. Then select the file storage to verify that a folder named product_data containing a file named products.csv has been copied to this location, as shown here:
-
Right-click the products.csv data file and select Preview to view the ingested data. Then close the preview.
Use a serverless SQL pool to analyze data
Now that you’ve ingested some data into your workspace, you can use Synapse Analytics to query and analyze it. One of the most common ways to query data is to use SQL, and in Synapse Analytics you can use a serverless SQL pool to run SQL code against data in a data lake.
- In Synapse Studio, right-click the products.csv file in the file storage for your Synapse workspace, point to New SQL script, and select Select TOP 100 rows.
-
In the SQL Script 1 pane that opens, review the SQL code that has been generated, which should be similar to this:
 -- This is auto-generated code
 SELECT
     TOP 100 *
 FROM
     OPENROWSET(
         BULK 'https://datalakexxxxxxx.dfs.core.windows.net/files/product_data/products.csv',
         FORMAT = 'CSV',
         PARSER_VERSION='2.0'
     ) AS [result]
This code opens a rowset from the text file you imported and retrieves the first 100 rows of data.
- In the Connect to list, ensure Built-in is selected - this represents the built-in SQL Pool that was created with your workspace.
-
On the toolbar, use the ▷ Run button to run the SQL code, and review the results, which should look similar to this:
C1 C2 C3 C4 ProductID ProductName Category ListPrice 771 Mountain-100 Silver, 38 Mountain Bikes 3399.9900 772 Mountain-100 Silver, 42 Mountain Bikes 3399.9900 … … … … -
Note the results consist of four columns named C1, C2, C3, and C4; and that the first row in the results contains the names of the data fields. To fix this problem, add a HEADER_ROW = TRUE parameters to the OPENROWSET function as shown here (replacing datalakexxxxxxx with the name of your data lake storage account), and then rerun the query:
 SELECT
     TOP 100 *
 FROM
     OPENROWSET(
         BULK 'https://datalakexxxxxxx.dfs.core.windows.net/files/product_data/products.csv',
         FORMAT = 'CSV',
         PARSER_VERSION='2.0',
         HEADER_ROW = TRUE
     ) AS [result]
Now the results look like this:
ProductID ProductName Category ListPrice 771 Mountain-100 Silver, 38 Mountain Bikes 3399.9900 772 Mountain-100 Silver, 42 Mountain Bikes 3399.9900 … … … … -
Modify the query as follows (replacing datalakexxxxxxx with the name of your data lake storage account):
SELECT Category, COUNT(*) AS ProductCount FROM OPENROWSET( BULK 'https://datalakexxxxxxx.dfs.core.windows.net/files/product_data/products.csv', FORMAT = 'CSV', PARSER_VERSION='2.0', HEADER_ROW = TRUE ) AS [result] GROUP BY Category; -
Run the modified query, which should return a resultset that contains the number products in each category, like this:
Category ProductCount Bib Shorts 3 Bike Racks 1 … … -
In the Properties pane for SQL Script 1, change the Name to Count Products by Category. Then in the toolbar, select Publish to save the script.
-
Close the Count Products by Category script pane.
-
In Synapse Studio, select the Develop page, and notice that your published Count Products by Category SQL script has been saved there.
-
Select the Count Products by Category SQL script to reopen it. Then ensure that the script is connected to the Built-in SQL pool and run it to retrieve the product counts.
- In the Results pane, select the Chart view, and then select the following settings for the chart:
- Chart type: Column
- Category column: Category
- Legend (series) columns: ProductCount
- Legend position: bottom - center
- Legend (series) label: Leave blank
- Legend (series) minimum value: Leave blank
- Legend (series) maximum: Leave blank
- Category label: Leave blank
The resulting chart should resemble this:
Use a Spark pool to analyze data
While SQL is a common language for querying structured datasets, many data analysts find languages like Python useful to explore and prepare data for analysis. In Azure Synapse Analytics, you can run Python (and other) code in a Spark pool; which uses a distributed data processing engine based on Apache Spark.
- in Synapse Studio, if the files tab you opened earlier containing the products.csv file is no longer open, on the Data page, browse product_data folder. Then right-click products.csv, point to New notebook, and select Load to DataFrame.
- In the Notebook 1 pane that opens, in the Attach to list, select the sparkxxxxxxx Spark pool and ensure that the Language is set to PySpark (Python).
-
Review the code in the first (and only) cell in the notebook, which should look like this:
%%pyspark df = spark.read.load('abfss://files@datalakexxxxxxx.dfs.core.windows.net/product_data/products.csv', format='csv' ## If header exists uncomment line below ##, header=True ) display(df.limit(10)) - Use the ▷ icon to the left of the code cell to run it, and wait for the results. The first time you run a cell in a notebook, the Spark pool is started - so it may take a minute or so to return any results.
-
Eventually, the results should appear below the cell, and they should be similar to this:
c0 c1 c2 c3 ProductID ProductName Category ListPrice 771 Mountain-100 Silver, 38 Mountain Bikes 3399.9900 772 Mountain-100 Silver, 42 Mountain Bikes 3399.9900 … … … … -
Uncomment the ,header=True line (because the products.csv file has the column headers in the first line), so your code looks like this:
%%pyspark df = spark.read.load('abfss://files@datalakexxxxxxx.dfs.core.windows.net/product_data/products.csv', format='csv' ## If header exists uncomment line below , header=True ) display(df.limit(10)) -
Rerun the cell and verify that the results look like this:
ProductID ProductName Category ListPrice 771 Mountain-100 Silver, 38 Mountain Bikes 3399.9900 772 Mountain-100 Silver, 42 Mountain Bikes 3399.9900 … … … … Notice that running the cell again takes less time, because the Spark pool is already started.
- Under the results, use the + Code icon to add a new code cell to the notebook.
-
In the new empty code cell, add the following code:
df_counts = df.groupby(df.Category).count() display(df_counts) -
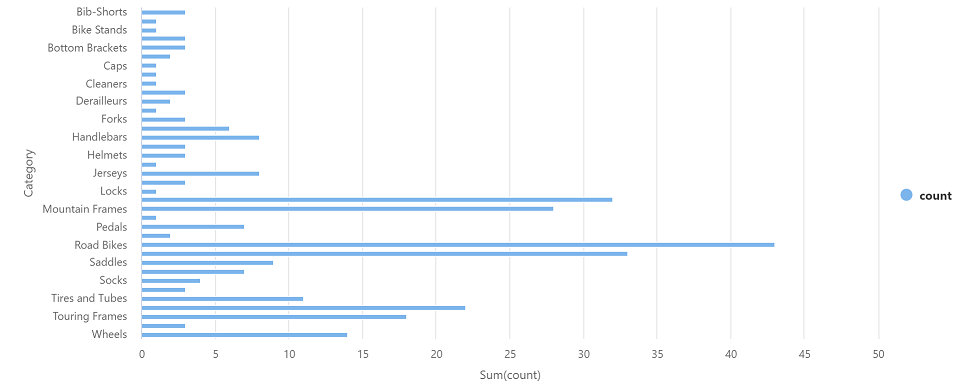
Run the new code cell by clicking its ▷ icon, and review the results, which should look similar to this:
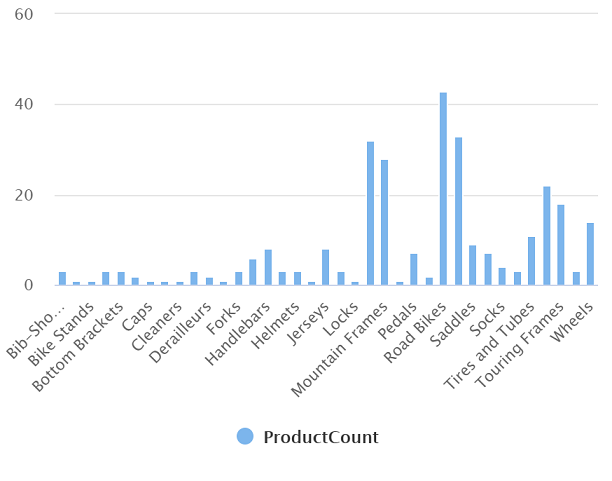
Category count Headsets 3 Wheels 14 … … -
In the results output for the cell, select the Chart view. The resulting chart should resemble this:
-
If it is not already visible, show the Properties page by selecting the Properties button (which looks similar to 🗏*) on the right end of the toolbar. Then in the Properties pane, change the notebook name to Explore products and use the Publish button on the toolbar to save it.
- Close the notebook pane and stop the Spark session when prompted. Then view the Develop page to verify that the notebook has been saved.
Use a dedicated SQL pool to query a data warehouse
So far you’ve seen some techniques for exploring and processing file-based data in a data lake. In many cases, an enterprise analytics solution uses a data lake to store and prepare unstructured data that can then be loaded into a relational data warehouse to support business intelligence (BI) workloads. In Azure Synapse Analytics, these data warehouses can be implemented in a dedicated SQL pool.
- In Synapse Studio, on the Manage page, in the SQL pools section, select the sqlxxxxxxx dedicated SQL pool row and then use its ▷ icon to resume it.
- Wait for the SQL pool to start. This can take a few minutes. Use the ↻ Refresh button to check its status periodically. The status will show as Online when it is ready.
- When the SQL pool has started, select the Data page; and on the Workspace tab, expand SQL databases and verify that sqlxxxxxxx is listed (use ↻ icon at the top-left of the page to refresh the view if necessary).
- Expand the sqlxxxxxxx database and its Tables folder, and then in the … menu for the FactInternetSales table, point to New SQL script, and select Select TOP 100 rows.
- Review the results of the query, which show the first 100 sales transactions in the table. This data was loaded into the database by the setup script, and is permanently stored in the database associated with the dedicated SQL pool.
-
Replace the SQL query with the following code:
SELECT d.CalendarYear, d.MonthNumberOfYear, d.EnglishMonthName, p.EnglishProductName AS Product, SUM(o.OrderQuantity) AS UnitsSold FROM dbo.FactInternetSales AS o JOIN dbo.DimDate AS d ON o.OrderDateKey = d.DateKey JOIN dbo.DimProduct AS p ON o.ProductKey = p.ProductKey GROUP BY d.CalendarYear, d.MonthNumberOfYear, d.EnglishMonthName, p.EnglishProductName ORDER BY d.MonthNumberOfYear - Use the ▷ Run button to run the modified query, which returns the quantity of each product sold by year and month.
-
If it is not already visible, show the Properties page by selecting the Properties button (which looks similar to 🗏*) on the right end of the toolbar. Then in the Properties pane, change the query name to Aggregate product sales and use the Publish button on the toolbar to save it.
-
Close the query pane, and then view the Develop page to verify that the SQL script has been saved.
- On the Manage page, select the sqlxxxxxxx dedicated SQL pool row and use its ❚❚ icon to pause it.
Explore data with a Data Explorer pool
Azure Synapse Data Explorer provides a runtime that you can use to store and query data by using Kusto Query Language (KQL). Kusto is optimized for data that includes a time series component, such as realtime data from log files or IoT devices.
Create a Data Explorer database and ingest data into a table
- In Synapse Studio, on the Manage page, in the Data Explorer pools section, select the adxxxxxxxx pool row and then use its ▷ icon to resume it.
- Wait for the pool to start. It can take some time. Use the ↻ Refresh button to check its status periodically. The status will show as online when it is ready.
- When the Data Explorer pool has started, view the Data page; and on the Workspace tab, expand Data Explorer Databases and verify that adxxxxxxxx is listed (use ↻ icon at the top-left of the page to refresh the view if necessary)
- In the Data pane, use the + icon to create a new Data Explorer database in the adxxxxxxxx pool with the name sales-data.
- In Synapse Studio, wait for the database to be created (a notification will be displayed).
- Switch to the Develop page, and in the KQL scripts list, select ingest-data. When the script opens, note that it contains two statements:
- A
.create tablestatement to create a table named sales. - An
.ingest into tablestatement to load data into the table from an HTTP source.
- A
- In the ingest-data pane, in the Connect to list, select your adxxxxxxxx pool, and in the Database list, select sales-data.
- In the script, highlight the
.create tablestatement, and then on the toolbar, use the ▷ Run button to run the selected code, which creates a table named sales. - After the table has been created, highlight the
.ingest into tablestatement and use the ▷ Run button to run it and ingest data into the table.
Note: In this example, you imported a very small amount of batch data from a file, which is fine for the purposes of this exercise. In reality, you can use Data Explorer to analyze much larger volumes of data; including realtime data from a streaming source such as Azure Event Hubs.
Use Kusto query language to query the table
- Switch back to the Data page and in the … menu for the sales-data database, select Refresh.
- Expand the sales-data database’s Tables folder. Then in the … menu for the sales table, select New KQL script > Take 1000 rows.
-
Review the generated query and its results. The query should contain the following code:
 sales
 | take 1000
The results of the query contain the first 1000 rows of data.
-
Modify the query as follows:
sales | where Item == 'Road-250 Black, 48' -
Use the ▷ Run button to run the query. Then review the results, which should contain only the rows for sales orders for the Road-250 Black, 48 product.
-
Modify the query as follows:
sales | where Item == 'Road-250 Black, 48' | where datetime_part('year', OrderDate) > 2020 -
Run the query and review the results, which should contain only sales orders for Road-250 Black, 48 made after 2020.
-
Modify the query as follows:
sales | where OrderDate between (datetime(2020-01-01 00:00:00) .. datetime(2020-12-31 23:59:59)) | summarize TotalNetRevenue = sum(UnitPrice) by Item | sort by Item asc -
Run the query and review the results, which should contain the total net revenue for each product between January 1st and December 31st 2020 in ascending order of product name.
-
If it is not already visible, show the Properties page by selecting the Properties button (which looks similar to 🗏*) on the right end of the toolbar. Then in the Properties pane, change the query name to Explore sales data and use the Publish button on the toolbar to save it.
-
Close the query pane, and then view the Develop page to verify that the KQL script has been saved.
- On the Manage page, select the adxxxxxxxx Data Explorer pool row and use its ❚❚ icon to pause it.
Delete Azure resources
Now that you’ve finished exploring Azure Synapse Analytics, you should delete the resources you’ve created to avoid unnecessary Azure costs.
- Close the Synapse Studio browser tab and return to the Azure portal.
- On the Azure portal, on the Home page, select Resource groups.
- Select the dp000-xxxxxxx resource group for your Synapse Analytics workspace (not the managed resource group), and verify that it contains the Synapse workspace, storage account, SQL pool, Data Explorer pool, and Spark pool for your workspace.
- At the top of the Overview page for your resource group, select Delete resource group.
-
Enter the dp000-xxxxxxx resource group name to confirm you want to delete it, and select Delete.
After a few minutes, your Azure Synapse workspace resource group and the managed workspace resource group associated with it will be deleted.