Create an ontology with Fabric IQ
In this lab, you’ll create a complete Fabric IQ ontology for a fictitious healthcare company by manually building each component—entity types, properties, keys, relationships, and data bindings. The sample data represents hospitals, departments, rooms, patients, vital sign equipment, and vital signs readings.
[!IMPORTANT] Ontology in Microsoft Fabric is currently in preview.
This lab takes approximately 40 minutes to complete.
Note: You need access to a Fabric paid or trial capacity to complete this exercise. For information about the free Fabric trial, see Fabric trial. You’ll also need to enable the following tenant settings: Enable Ontology item (preview) and User can create Graph (preview).
Create a workspace
- Navigate to the Microsoft Fabric home page at
https://app.fabric.microsoft.com/home?experience=fabricin a browser, and sign in with your Fabric credentials. - In the menu bar on the left, select Workspaces (the icon looks similar to 🗇).
- Create a new workspace with a name of your choice, selecting a licensing mode in one of the following workspace types: Fabric, Fabric Trial, or Power BI Premium.
- When your new workspace opens, it should be empty.
Create a lakehouse with sample data
Now you’ll create a lakehouse and load hospital operations data that will form the basis of your ontology.
- In your workspace, select + New item > Lakehouse.
- Name the lakehouse
LamnaHealthcareLHand select Create. - When the lakehouse opens, you’ll upload CSV files and convert them to tables.
Download and load the hospital data files
You’ll download sample data files, upload them to the lakehouse, and convert them to tables.
- Download sample-data.zip and extract the CSV files to your local computer. The ZIP file contains:
- Hospitals.csv - Healthcare facilities in your network
- Departments.csv - Hospital departments (ICU, Emergency, Surgical)
- Rooms.csv - Individual rooms within departments
- Patients.csv - Current patients and their room assignments
- VitalSignEquipment.csv - Monitoring equipment assigned to patients (which patient is being monitored, and when monitoring started)
- VitalSignsReadings.csv - Actual patient vital sign measurements (heart rate, oxygen levels) collected over time from the monitors
- Upload the five lakehouse files:
- In the lakehouse, select Upload files from the main view
- Browse to and select these five files: Hospitals.csv, Departments.csv, Rooms.csv, Patients.csv, VitalSignEquipment.csv
- Select Open
- Select Upload to upload all five files at once
- Wait for the upload to complete
Note: You’ll upload VitalSignsReadings.csv to an eventhouse later, not to the lakehouse.
- Convert each uploaded file to a table:
- In Explorer, select the Files folder, where you should see all five CSV files
- For each file, select the ellipsis (…) to the right of the file name
- Select Load to Tables > New table
- Configure the table:
- Table name: Use the file name without extension in lowercase (e.g.,
hospitals,departments,rooms,patients,vitalsignequipment) - Column header: Check Use header for column names
- Separator: Leave as comma (
,)
- Table name: Use the file name without extension in lowercase (e.g.,
- Select Load
- Repeat this process for all five files
-
Verify you have five tables in the Tables section:
hospitals,departments,rooms,patients, andvitalsignequipmentas shown in the image below.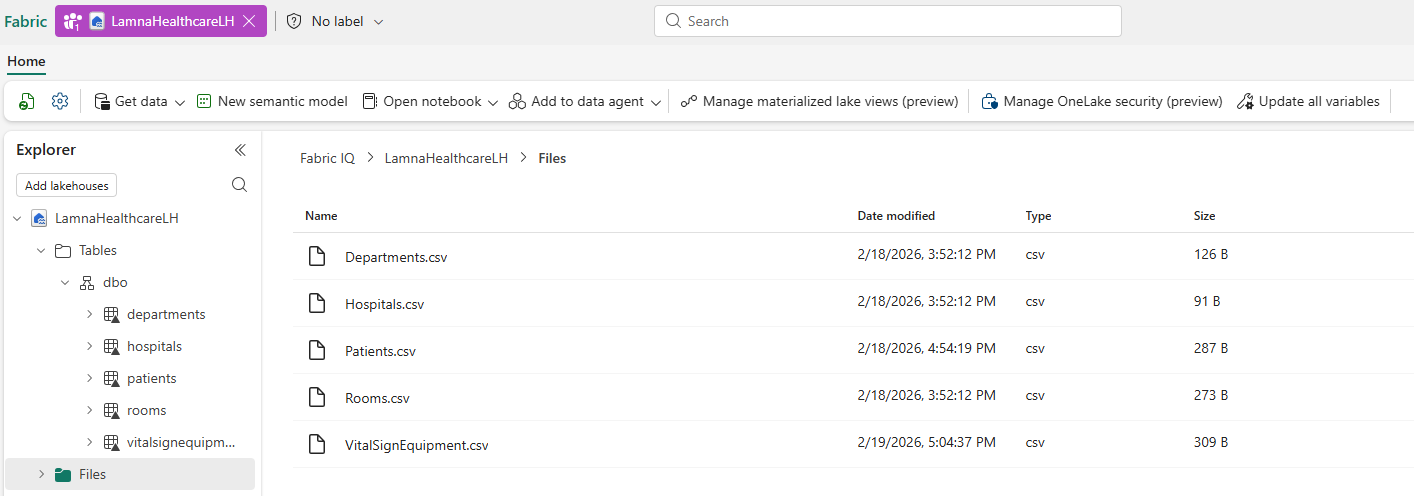
Create an eventhouse with streaming data
Next, you’ll create an eventhouse to store real-time vital signs data that you’ll bind to the ontology later.
- In your workspace, select + New item > Eventhouse.
- Name the eventhouse
LamnaHealthcareEHand select Create. - A default KQL database is created with the same name. Select the KQL database to open it.
Ingest vital signs data
- In the KQL database, select Get data > Local file.
- In the Select or create a destination table section, select + New table and enter
VitalSignsReadingsas the table name. - Under Add up to 1,000 files, select Browse for files and upload the VitalSignsReadings.csv file you downloaded earlier.
- Select Next, then continue through the ingestion wizard, keeping the default settings.
- Select Finish to complete the ingestion.
-
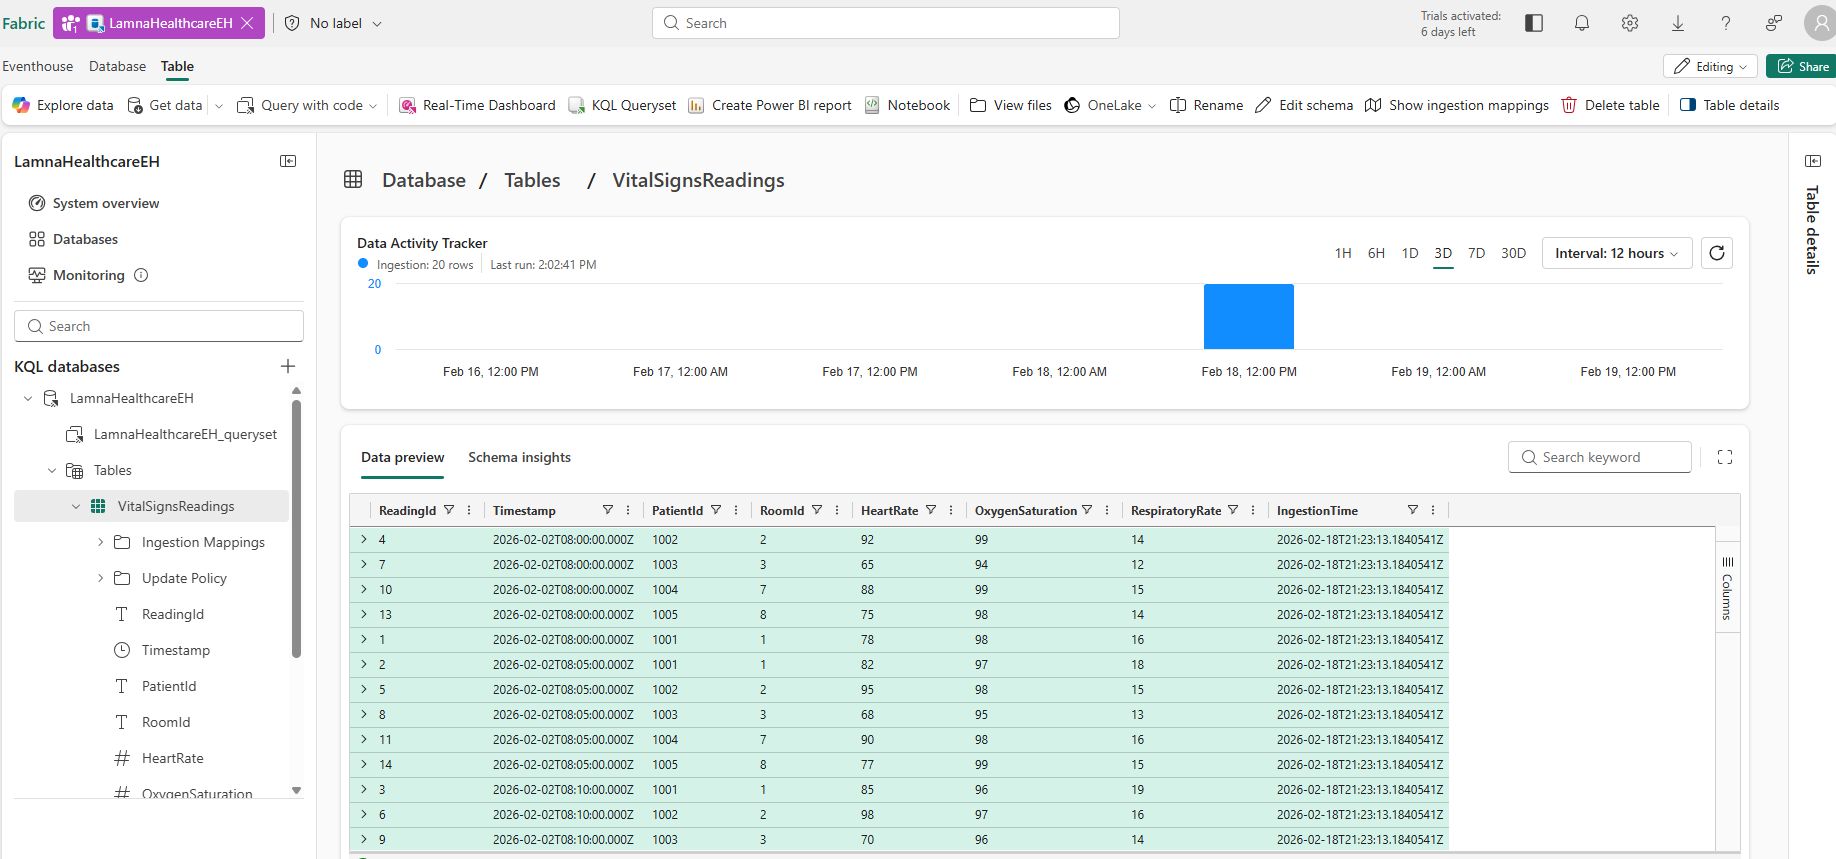
Verify the VitalSignsReadings table appears in the KQL database.
Your KQL database should now show the VitalSignsReadings table:
Create an ontology
Now you’ll create an empty ontology and build it step by step.
- In your workspace, select + New item > Ontology (preview).
- Name the ontology
LamnaHealthcareOntologyand select Create. - The ontology canvas opens, empty and ready for you to build your data model.
Create entity types
You’ll create five entity types representing the healthcare domain. Follow the detailed steps for the first entity type to learn the process, then use the reference table to create the remaining four.
Create Hospital entity type
- In the ontology ribbon, select Add entity type.
- Enter Hospital as the entity type name and select Add Entity Type.
- The Hospital entity type appears on the canvas.
- With the Hospital entity type selected, go to the Entity type configuration pane on the right.
- Select the Properties tab, then select Add properties.
-
Add each property by entering the details below and selecting + Add after each one:
Property Name Data Type Property Type HospitalId Integer Static HospitalName String Static City String Static State String Static -
After adding all properties, select Save.
-
Now you need to define an entity key. An entity key is a property that uniquely identifies each instance of the entity type. For hospitals, each hospital has a unique HospitalId, so this will be the key.
Select Key: Add entity type key and choose HospitalId as the key, select Save.
Create remaining entity types
Follow the same process to create these four additional entity types with their properties and keys:
| Entity Type | Property Name | Data Type | Property Type | Entity Type Key |
|---|---|---|---|---|
| Department | DepartmentIdDepartmentNameHospitalIdFloor |
Integer String Integer Integer |
Static Static Static Static |
DepartmentId |
| Room | RoomIdRoomNumberDepartmentIdRoomType |
Integer String Integer String |
Static Static Static Static |
RoomId |
| Patient | PatientIdFirstNameLastNameDateOfBirthAdmissionDateCurrentRoomId |
Integer String String DateTime DateTime Integer |
Static Static Static Static Static Static |
PatientId |
| VitalSignEquipment | EquipmentIdPatientIdEquipmentTypeMonitoringStartDate |
String Integer String DateTime |
Static Static Static Static |
EquipmentId |
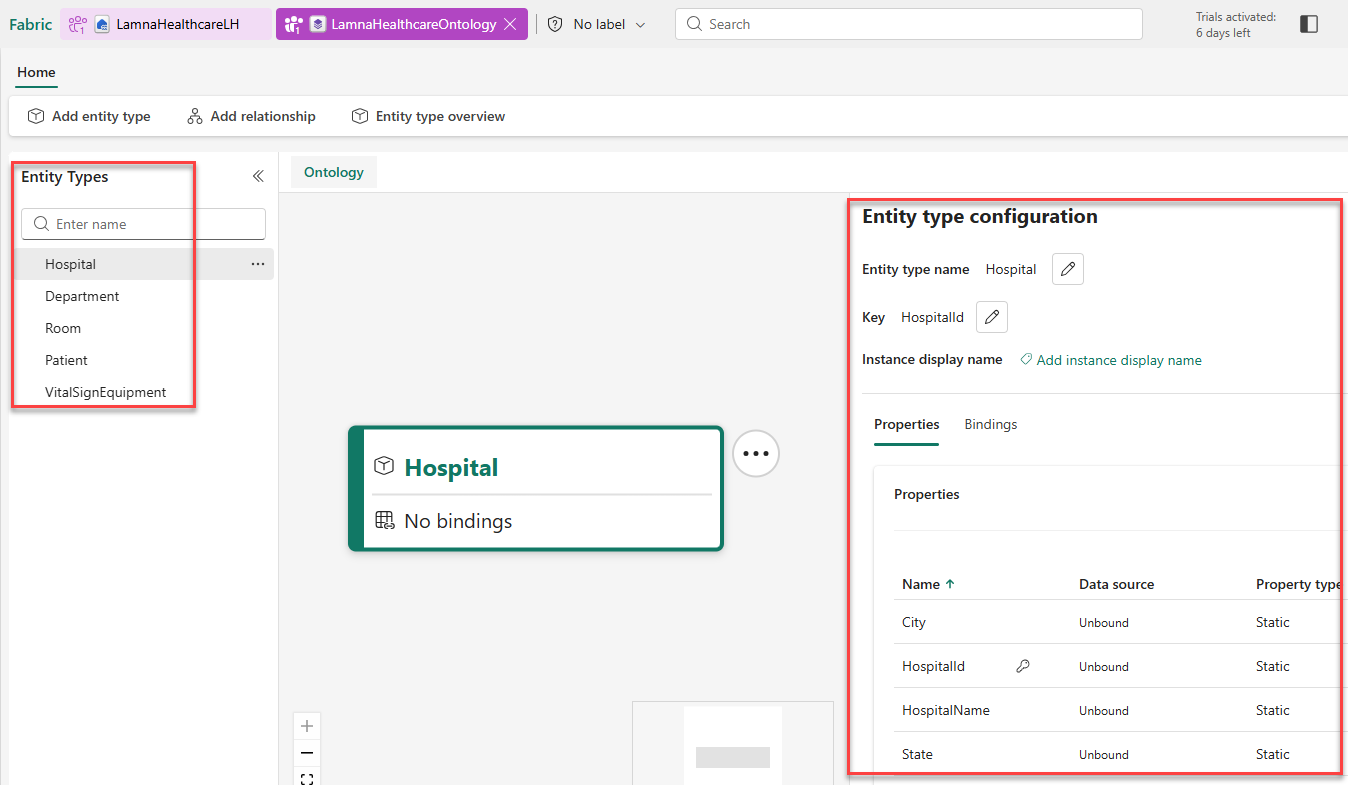
You now have five entity types with properties and keys defined. Verify that the Entity Types pane shows all five entity types, and that properties and entity type key have been defined for each entity:
Create relationship types
Now, you’ll create relationship types that model the healthcare entity relationships and vital sign monitoring: Hospital → Department → Room → Patient, with VitalSignEquipment monitoring Patient. Follow the detailed steps for the first relationship, then use the reference table to create the remaining three.
Create Hospital-Department relationship
- In the ribbon, select Add relationship.
- In the Add relationship type to ontology dialog, configure:
- Relationship type name:
contains - Source entity type:
Hospital - Target entity type:
Department
- Relationship type name:
- Select Add relationship type.
The Contains relationship line appears on the canvas connecting Hospital to Department. You’ll configure the data source later.
Create remaining relationships
Follow the same process to create these four additional relationships:
| Relationship Name | Source Entity Type | Target Entity Type | Meaning |
|---|---|---|---|
| has | Department | Room | Departments have rooms |
| assignedTo | Patient | Room | Patients are assigned to rooms |
| monitors | VitalSignEquipment | Patient | Vital sign equipment monitors patients |
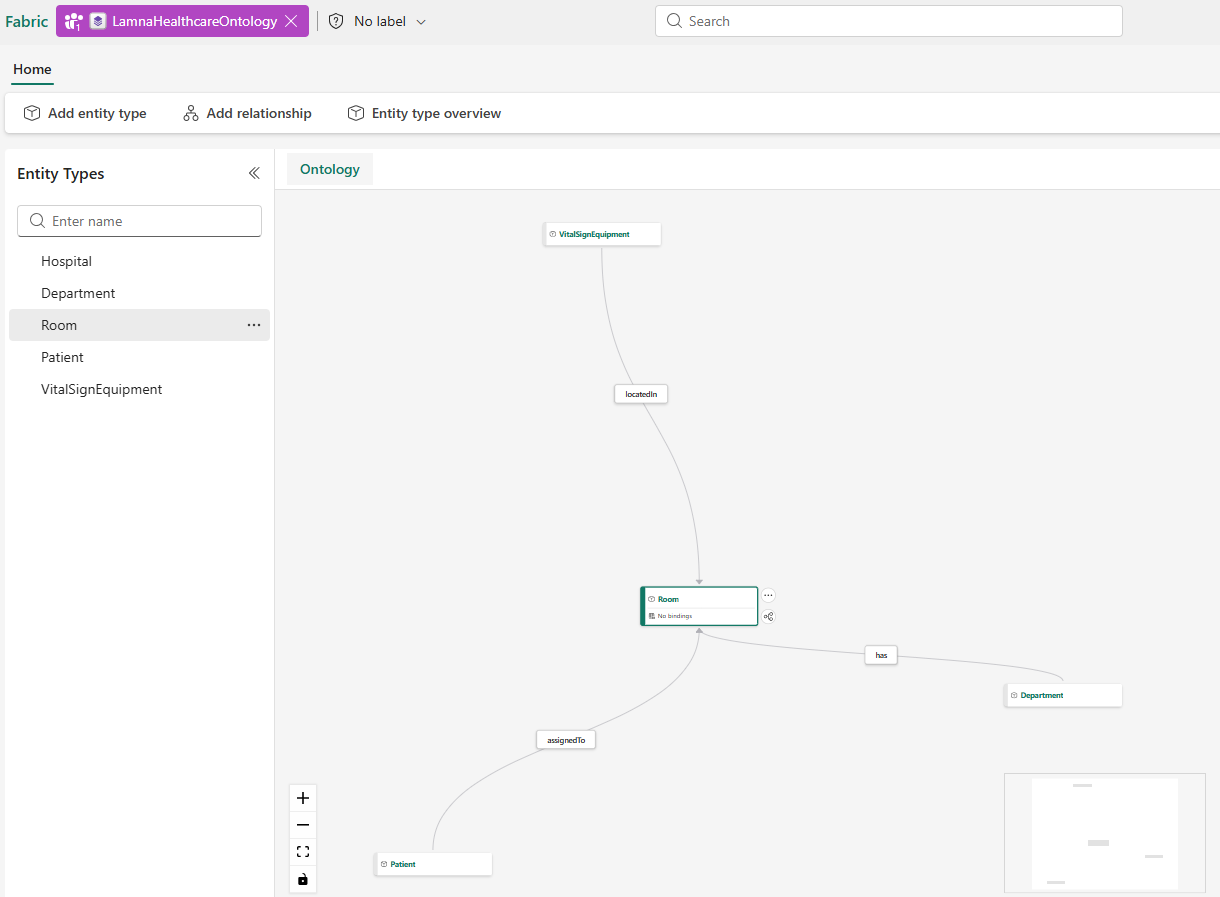
Your ontology canvas should look similar to the image below. Depending on canvas layout and which entities are selected, you may need to pan or zoom to view all entity types and relationship lines.
Your ontology structure is complete. Now you need to bind entity properties to actual data sources.
Bind entity types to data
So far, you’ve defined the schema of your ontology—entity types with properties and keys—but these are just empty templates. To make the ontology functional, you must bind each entity type to actual data sources. This tells Fabric where to find the real healthcare data that will populate your ontology.
You’ll bind static data from lakehouse tables to four entities, then add both static and time-series bindings to the VitalSignEquipment entity.
Bind Hospital entity
- Select the Hospital entity type on the canvas.
- In the Entity type configuration pane, go to the Bindings tab.
- Select Add data to entity type.
- In the OneLake catalog, select LamnaHealthcareLH (lakehouse) from your workspace.
- Select Connect.
- Select the hospitals table and select Next.
- For Binding type, keep Static.
- Under Bind your properties, map each property to its corresponding column:
- HospitalId → HospitalId
- HospitalName → HospitalName
- City → City
- State → State
The system usually auto-maps when names match.
- Select Save.
Bind Department, Room, and Patient entities
Follow the same binding process for these three entities, which only require static data bindings. The system automatically maps columns to properties when names match—just verify the mappings are correct.
| Entity Type | Table Name | Source Columns |
|---|---|---|
| Department | departments | DepartmentIdDepartmentNameHospitalIdFloor |
| Room | rooms | RoomIdRoomNumberDepartmentIdRoomType |
| Patient | patients | PatientIdFirstNameLastNameDateOfBirthAdmissionDateCurrentRoomId |
Bind VitalSignEquipment entity
The VitalSignEquipment entity requires two data bindings: one for static equipment attributes and one for time-series measurements. Time-series bindings require static bindings first. Here’s why—look at what each data source contains:
VitalSignEquipment.csv (Lakehouse - Static attributes):
EquipmentId | PatientId | EquipmentType           | MonitoringStartDate
VS-1001     | 1001      | Continuous Monitoring   | 2026-02-01
VS-1002     | 1002      | Continuous Monitoring   | 2026-02-01
VitalSignsReadings.csv (Eventhouse - Time-series measurements):
ReadingId | EquipmentId | Timestamp            | HeartRate | OxygenSaturation | RespiratoryRate
1         | VS-1001     | 2026-02-02T08:00:00Z | 78        | 98               | 16
2         | VS-1001     | 2026-02-02T08:05:00Z | 82        | 97               | 18
4         | VS-1002     | 2026-02-02T08:00:00Z | 92        | 99               | 14
Notice the time-series data only has measurements and EquipmentId—not patient or equipment type. The static binding creates the equipment entities with full context (VS-1001 is Continuous Monitoring equipment tracking Patient 1001), and the time-series binding attaches streaming measurements to those entities using EquipmentId as the matching key.
Bind static monitor reference data
- Select the VitalSignEquipment entity type.
- In the Bindings tab, select Add data to entity type.
- In the OneLake catalog, select LamnaHealthcareLH (lakehouse) from your workspace.
- Select Connect.
- Select the vitalsignequipment table and select Next.
- Keep Static binding type.
- Map the properties to columns (should auto-map):
- EquipmentId → EquipmentId
- PatientId → PatientId
- EquipmentType → EquipmentType
- MonitoringStartDate → MonitoringStartDate
- Select Save.
Bind time-series vital signs data
Now you’ll add real-time vital signs readings as time-series properties.
- With VitalSignEquipment still selected, in the Bindings tab, select Add data to entity type again.
- In the OneLake catalog, select LamnaHealthcareEH (eventhouse) from your workspace.
- Select Connect.
- Select the VitalSignsReadings table and select Next.
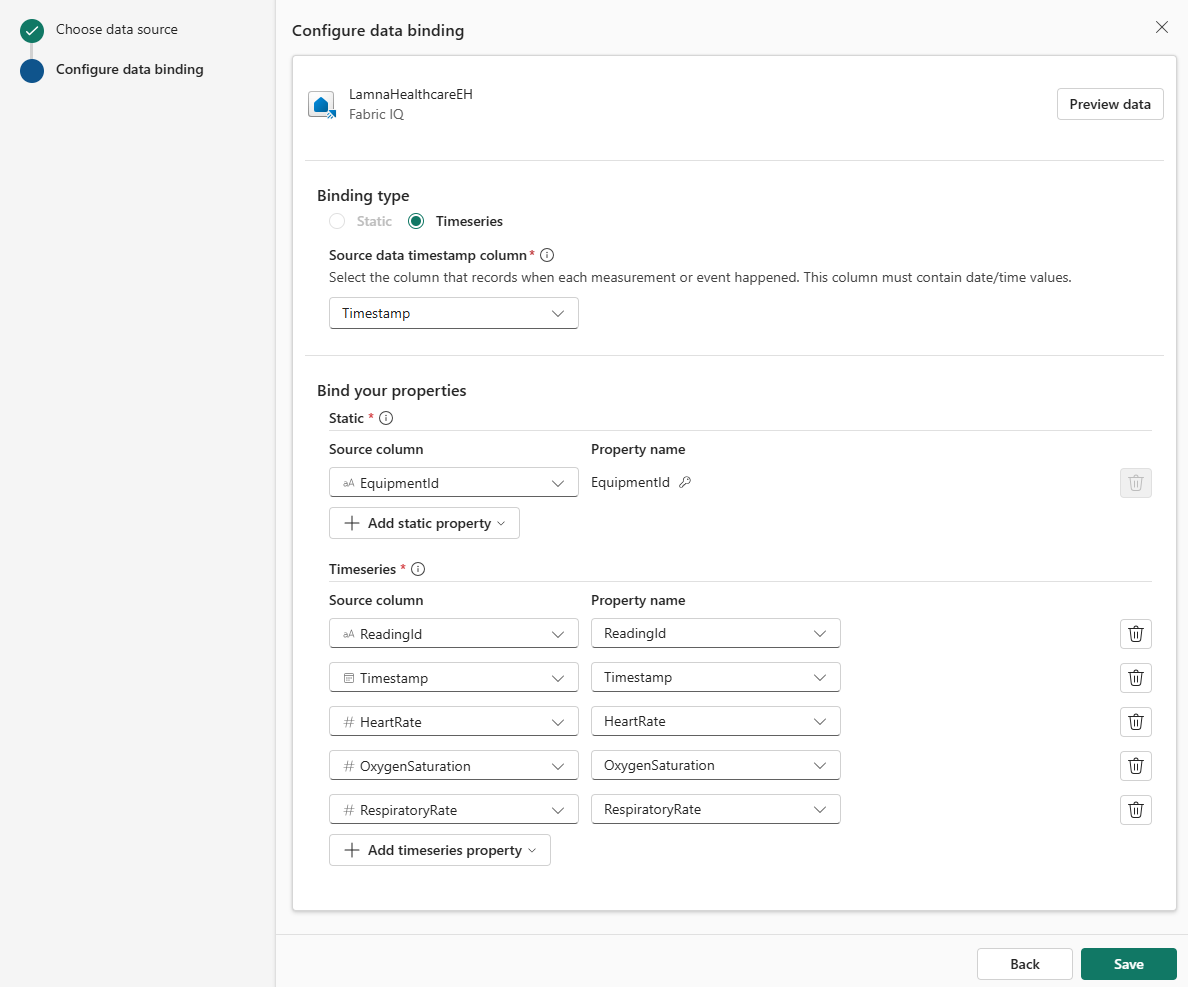
- For Binding type, select Time series.
-
For Source data timestamp column select
Timestamp[!IMPORTANT] Time-series bindings require a matching key from static data. You must have the static binding configured first (which you just did).
- Configure the time-series binding:
- Static section - Maps the key to link streaming data to entities:
- Select EquipmentId as the column that connects streaming readings to equipment entities
- This matches the EquipmentId column from your static binding
- Time series section - Map the properties to columns (should auto-map):
- ReadingId → ReadingId
- Timestamp → Timestamp
- HeartRate → HeartRate
- OxygenSaturation → OxygenSaturation
- RespiratoryRate → RespiratoryRate
Your time-series binding configuration should look like this:
- Static section - Maps the key to link streaming data to entities:
- Select Save to save the time-series binding.
Your VitalSignEquipment entity now has both static reference data (which monitors are where) and time-series data (actual vital sign readings over time).
All five entity types now have data bindings connecting their properties to data sources.
Configure relationships
Now you’ll configure each relationship type by specifying which table links the entity instances together. First you’ll configure one relationship using the details below, then use the reference table for the remaining four.
Configure Hospital-Department relationship
- On the ontology canvas, select the Hospital entity, then select contains in the relationship line between Hospital and Department.
- In the Relationship configuration pane on the right, configure the source data location:
- Workspace: Select your workspace
- Lakehouse: Select LamnaHealthcareLH
- Schema: Select dbo
- Table: Select departments
Note: The departments table works as the relationship source because it contains keys for both Hospital (HospitalId) and Department (DepartmentId). The hospitals table wouldn’t work here because it only contains HospitalId.
-
Configure the entity type mappings by selecting columns that match the key properties defined on each entity:
- Under 1. Source entity type: Select Hospital (change from default if needed)
- Source column: Select HospitalId (matches the HospitalId key defined on the Hospital entity)
- Under 2. Target entity type: Select Department (change from default if needed)
- Source column: Select DepartmentId (matches the DepartmentId key defined on the Department entity)
Your relationship configuration should look like this:
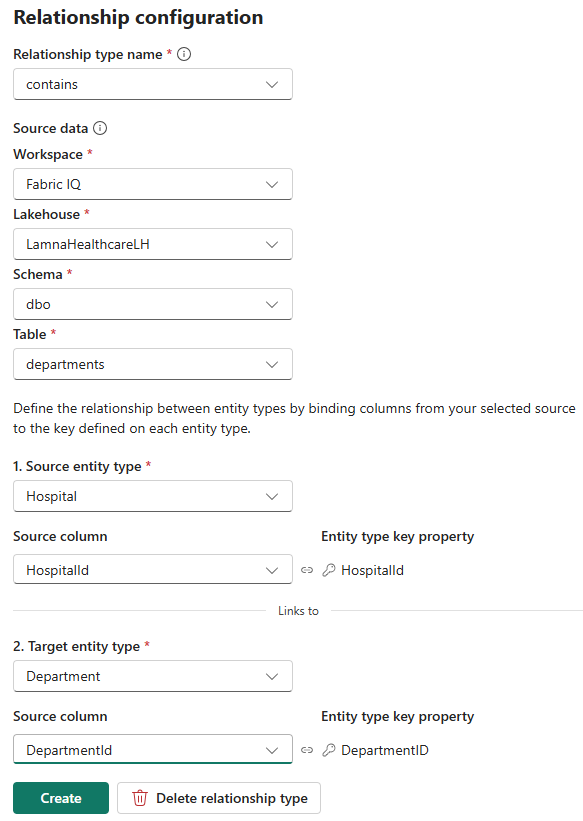
- Under 1. Source entity type: Select Hospital (change from default if needed)
- Select Create
Configure remaining relationships
Follow the same process for the remaining four relationships. For each: select the relationship line on the canvas, configure the source data and column mappings in the Relationship configuration pane, and select Create.
| Relationship | Source Data | Source Entity Column | Target Entity Column |
|---|---|---|---|
| has (Department → Room) | LamnaHealthcareLH > dbo > rooms | Department: DepartmentId | Room: RoomId |
| assignedTo (Patient → Room) | LamnaHealthcareLH > dbo > patients | Patient: PatientId | Room: CurrentRoomId |
| monitors (VitalSignEquipment → Patient) | LamnaHealthcareLH > dbo > vitalsignequipment | VitalSignEquipment: EquipmentId | Patient: PatientId |
All relationships now have source data configured. Your ontology understands the complete healthcare data model: hospitals contain departments, departments contain rooms, patients are assigned to rooms, and vital sign equipment monitors patients.
Preview the ontology
Your ontology is now complete with entities, relationships, static data, and time-series data—all built manually from the ground up.
- Select Room from the Entity Types list.
- In the ontology ribbon, select Entity type overview.
-
You’ll see an “Updating your ontology” message while the system processes your data in the background. After 1-2 minutes, refresh your browser to display the entity type overview.
You’ll see tiles showing:
- Relationship graph: Visual representation of how this entity type connects to other entity types
- Property charts: Bar charts showing the distribution of property values (like RoomType, RoomNumber, or DepartmentId)
- Entity instances table: List of all individual room instances with their properties
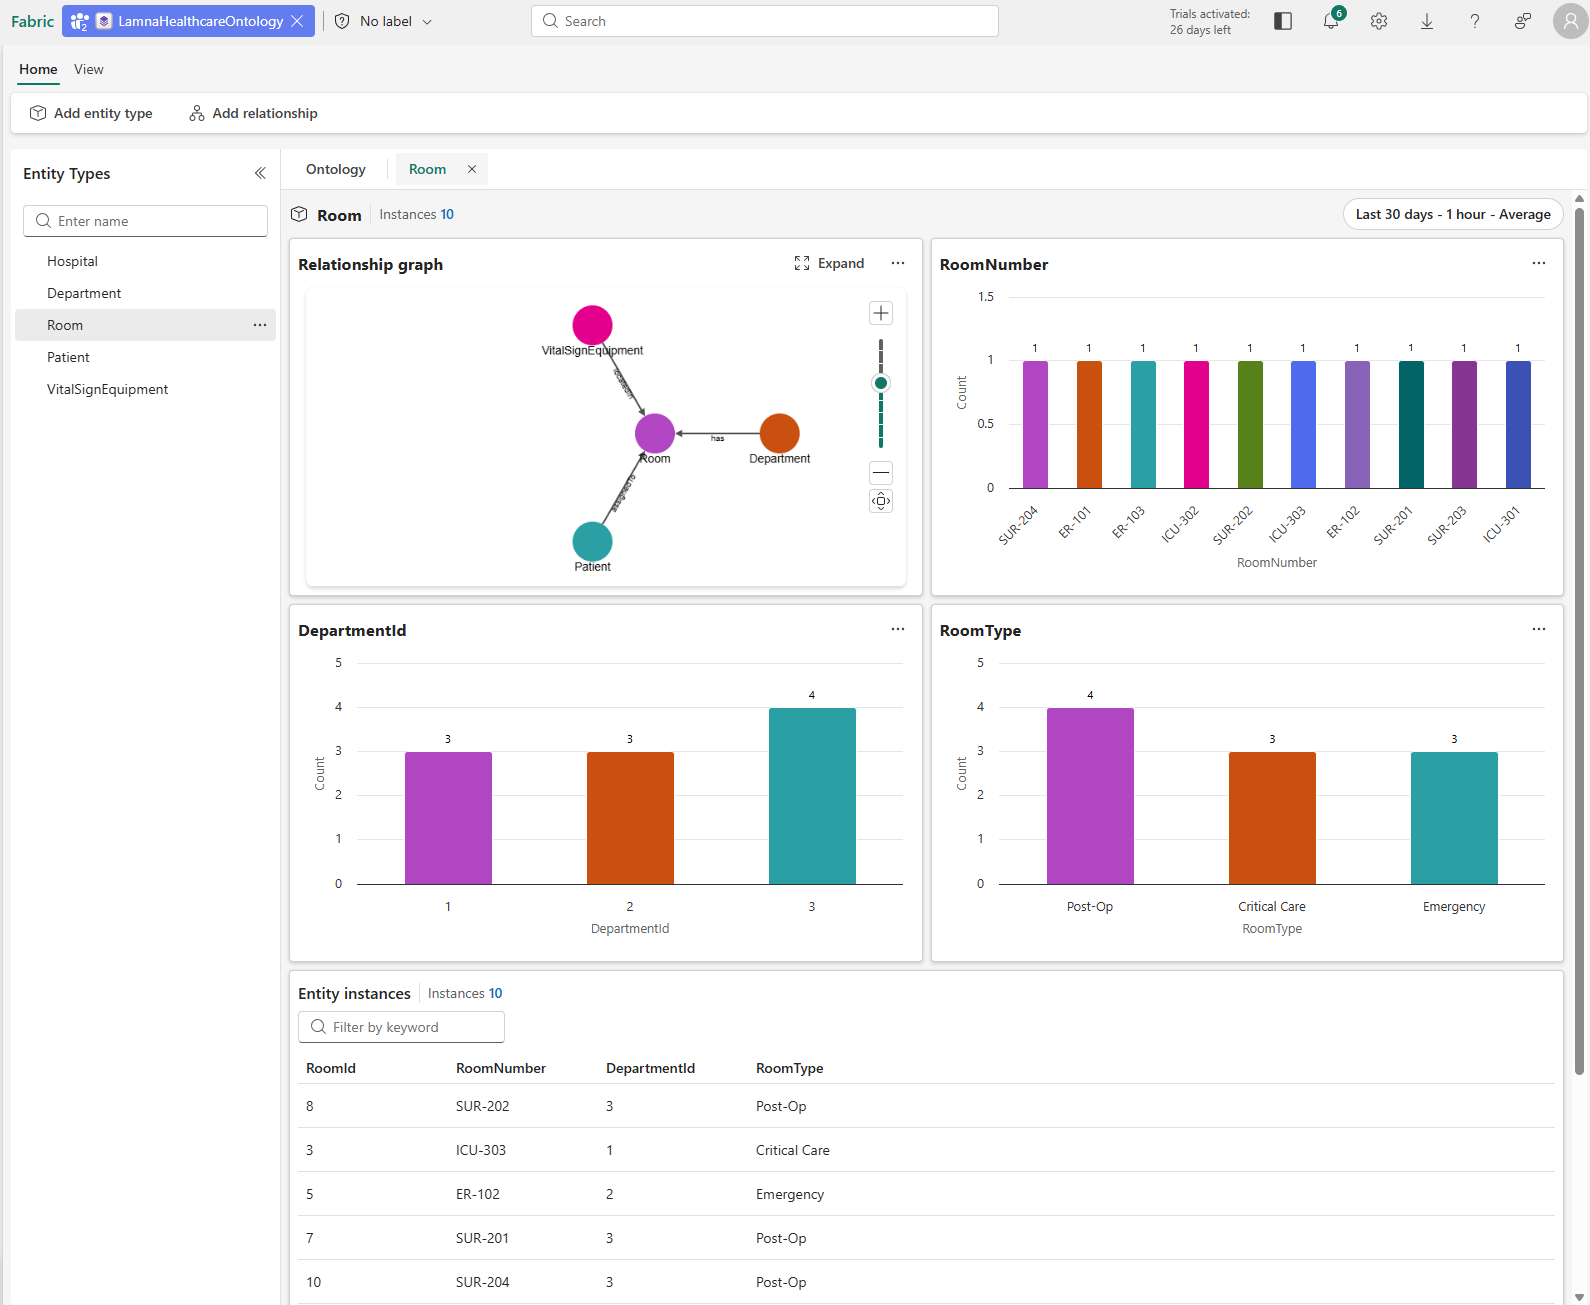
- In the Entity instances table, select any room instance (for example, ICU-302).
- The instance view opens, showing the properties for this specific room and its connections to other entities.
You’ve successfully built a complete ontology from the ground up—defining entity types, configuring relationships, binding data from both lakehouse tables and eventhouse streams, and creating a unified semantic layer. Your ontology now represents the healthcare domain with business vocabulary and connects operational data with real-time vital signs monitoring. This ontology is ready to power graph queries and AI agents.
Clean up resources (optional)
You can keep this workspace and ontology to continue exploring Fabric IQ capabilities. If you want to remove the resources you created in this exercise, follow these steps:
- In the bar on the left, select the icon for your workspace to view all of the items it contains.
- Select Workspace settings.
- In the General section, select Remove this workspace.