Optimize semantic model performance
In this exercise, you open a Power BI Desktop report built on AdventureWorks sales data. The report contains measures that use inefficient DAX patterns. You use Performance analyzer to capture timing data, identify the most expensive visual, analyze the DAX query, apply an optimization, and re-measure to confirm the improvement. You also explore cardinality by examining column statistics in the model. You learn how to:
- Use Performance analyzer to capture and interpret timing data for report visuals.
- Export a slow DAX query and analyze it in DAX query view.
- Identify and fix expensive DAX patterns using variables.
- Examine column cardinality to understand where memory consumption is highest.
- Verify performance improvements by comparing before and after measurements.
This lab takes approximately 30 minutes to complete.
Tip: For related training content, see Optimize semantic model performance.
Before you start
You need Power BI Desktop (November 2025 or newer) installed to complete this exercise. Note: UI elements may vary slightly depending on your version.
-
Open a web browser and enter the following URL to download the 16-optimize-performance zip folder:
https://github.com/MicrosoftLearning/mslearn-fabric/raw/refs/heads/main/Allfiles/Labs/16/16-optimize-performance.zip -
Save the file in Downloads and extract the zip file to the 16-optimize-performance folder.
-
Open the 16-Starter-Sales Analysis.pbix file from the folder you extracted.
Note: Ignore and close any warnings asking to apply changes, but don’t select Discard changes.
This file contains an AdventureWorks sales model with a report page that includes several visuals. Some measures in this model use intentionally inefficient DAX patterns that you identify and fix.
Capture a performance baseline
In this task, you use Performance analyzer to measure how long each visual takes to load. These timings serve as your baseline so you can compare them after you apply an optimization.
-
In Power BI Desktop, navigate to the Sales Overview report page.
-
On the Optimize ribbon, select Performance analyzer.
The Performance analyzer pane opens on the right side of the report canvas.
-
In the Performance analyzer pane, select Start recording.
-
Select Refresh visuals to reload all visuals on the current page.
-
Wait for all visuals to finish loading, then select Stop recording.
-
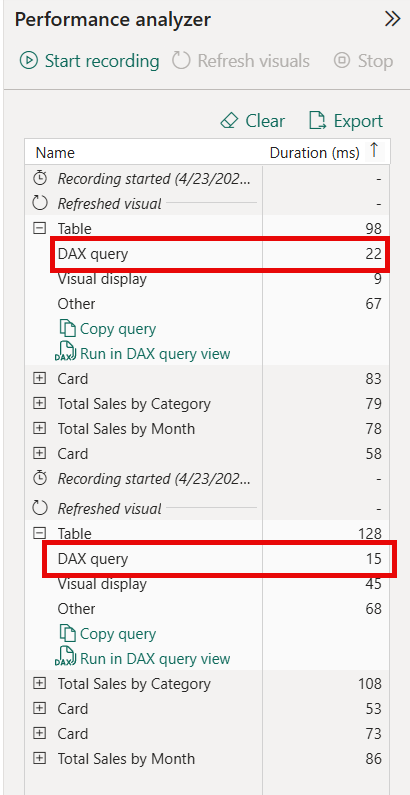
In the Performance analyzer results, expand the entry for the Table visual. This table displays Year, Total Sales, and Sales YoY Growth.
-
Take note of the DAX query time (in milliseconds) for this visual. This is your baseline.
Note: With the AdventureWorks dataset, query times may be small (under 500 ms). That’s expected — this dataset isn’t large. The goal is to learn the diagnostic process. Even a change from 80 ms to 30 ms demonstrates that the optimization worked. If all timings appear identical, select Clear, then select Refresh visuals again to get uncached measurements.
Analyze the slow DAX query
In this task, you export the DAX query for the Table visual and examine its structure. Then you look at the underlying measure formula to find the inefficient pattern.
-
In the Performance analyzer pane, expand the entry for the Table visual if it isn’t already expanded.
-
Select Run in DAX query view. Power BI Desktop opens DAX query view with the visual’s generated query.
-
Select Run to execute the query. The result grid shows values for each fiscal year:
Total_SalesandSales_YoY_Growth. -
Review the generated query. It looks something like this:
 DEFINE
     VAR __DS0Core =
         SUMMARIZECOLUMNS(
             ROLLUPADDISSUBTOTAL('Date'[Year], "IsGrandTotalRowTotal"),
             "Total_Sales", 'Sales'[Total Sales],
             "Sales_YoY_Growth", 'Sales'[Sales YoY Growth]
         )

     VAR __DS0PrimaryWindowed =
         TOPN(502, __DS0Core, [IsGrandTotalRowTotal], 0, 'Date'[Year], 1)

 EVALUATE
     __DS0PrimaryWindowed

 ORDER BY
     [IsGrandTotalRowTotal] DESC, 'Date'[Year]
This query is not the measure definition itself. Power BI generates this query to populate the visual.
SUMMARIZECOLUMNSgroups the data by year,ROLLUPADDISSUBTOTALadds the grand total row, andTOPNcaps the row count. The measures ([Total Sales]and[Sales YoY Growth]) are referenced by name, but their formulas aren’t shown here because they live in the model. To see the actual measure logic, you need to look in the formula bar. -
Switch back to Report view. In the Data pane, expand the Sales table and select the Sales YoY Growth measure. The formula bar shows the measure definition:
Sales YoY Growth = DIVIDE( [Total Sales] - CALCULATE([Total Sales], SAMEPERIODLASTYEAR('Date'[Date])), CALCULATE([Total Sales], SAMEPERIODLASTYEAR('Date'[Date])) ) -
Look at the formula. The
CALCULATE([Total Sales], SAMEPERIODLASTYEAR('Date'[Date]))expression appears twice, in the numerator and the denominator, but it calculates the same value both times. This means the engine evaluates the prior-year sales calculation twice per row in the query, which is wasteful.Common inefficient patterns like this include:
- Repeated subexpressions: The same
CALCULATEevaluated multiple times without storing it in aVAR. - FILTER on a full table:
FILTER(Sales, ...)iterating every row instead of using a column predicate inCALCULATE. - COUNTROWS(FILTER(…)): Counting rows by iterating a filtered table instead of using
CALCULATE(COUNTROWS(...), ...).
- Repeated subexpressions: The same
The Sales YoY Growth measure has a repeated subexpression — the prior-year calculation is evaluated twice. In the next task, you fix this by storing it in a variable.
Optimize the DAX measure
In this task, you rewrite the Sales YoY Growth measure using a variable so the prior-year calculation is evaluated only once.
-
In Report view, select the Sales YoY Growth measure in the Data pane so its formula appears in the formula bar.
-
Select all the text in the formula bar and replace it with the following optimized version:
 Sales YoY Growth =
 VAR SalesPriorYear =
     CALCULATE([Total Sales], SAMEPERIODLASTYEAR('Date'[Date]))
 RETURN
     DIVIDE([Total Sales] - SalesPriorYear, SalesPriorYear)
The
VARstores the prior-year result once. TheRETURNexpression referencesSalesPriorYeartwice without recalculating it. -
Press Enter to confirm the formula change.
-
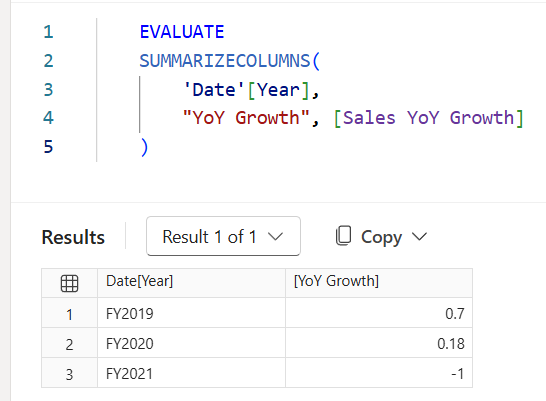
To verify the measure still returns the correct values, switch to DAX query view, open a new query tab, and run the following query:
 EVALUATE
 SUMMARIZECOLUMNS(
     'Date'[Year],
     "YoY Growth", [Sales YoY Growth]
 )
Compare the results to what you saw earlier. The values should be the same — for example, FY2019 should still show approximately 0.7 and FY2020 approximately 0.18. The optimization changes speed, not results.
Examine column cardinality
In this task, you use the COLUMNSTATISTICS() DAX function to see how many distinct values each column contains. Columns with high cardinality compress less efficiently and consume more memory. Understanding where cardinality is highest helps you make informed decisions about model design.
-
Switch to DAX query view in Power BI Desktop.
-
In a new query tab, enter the following query and select Run:
 DEFINE
     VAR _stats = COLUMNSTATISTICS()
 EVALUATE
     FILTER(_stats, NOT CONTAINSSTRING([Column Name], "RowNumber-"))
 ORDER BY [Cardinality] DESC
The result grid returns one row per column in the model, sorted by the number of distinct values. The
FILTERexcludes internal system columns that aren’t part of your model. The columns with the highest cardinality appear at the top. -
Review the results and notice where the highest cardinality columns come from:
- SalesOrderNumber in the Sales table has the highest cardinality (3,616) — nearly one distinct value per row. This is typical for transaction identifiers in fact tables.
- Date in the Date table is second (1,826). The calendar table covers a wider date range than the actual sales data, so it has more distinct values than OrderDate (990) in the Sales table.
- Cost (1,430) and Sales (1,411) have high cardinality for numeric columns — many distinct decimal values. Rounding to fewer decimal places is one way to reduce cardinality for numeric columns.
- ResellerKey (701) and Reseller (699) are nearly 1:1, which is expected for a dimension key and its label.
-
Notice that fact table columns (Sales) dominate the top of the list. In a star schema, dimension tables stay small while fact tables drive memory consumption. This is why fact table optimization has the biggest impact.
Verify the improvements
In this task, you re-run Performance analyzer to compare against your baseline now that you’ve optimized the Sales YoY Growth measure.
-
Switch to Report view and open the Performance analyzer pane if it isn’t already open.
-
Select Clear, then select Start recording.
-
Select Refresh visuals and wait for all visuals to finish loading.
-
Select Stop recording.
-
Expand the Table visual entry and compare its DAX query time to the baseline you recorded earlier.
Note: The absolute difference may be small with this dataset. The important takeaway is the process: measure → diagnose → fix → verify.
Try it with Copilot (Optional)
In this task, you use Copilot in DAX query view to get AI-powered suggestions for simplifying and optimizing your DAX queries.
If Copilot is available in your Power BI Desktop environment, try these additional steps:
-
In Performance analyzer, select Copy query for any visual.
-
Switch to DAX query view. Paste the query and ask Copilot:
Simplify this DAX query and suggest performance improvements. -
Review Copilot’s suggestions. Compare them to the manual optimization you applied.
-
Ask Copilot:
Explain why evaluating the same CALCULATE expression twice is slower than using a variable. -
Optionally, ask Copilot to generate a new measure using best practices from the start:
Write a measure that calculates profit margin percentage using variables for Sales and Cost.
Note: Copilot generates new insights and suggestions without changing the measures you already optimized.
Clean up resources
- Close Power BI Desktop. There’s no need to save the file.