Create reusable Power BI assets
In this exercise, you’ll create reusable assets to support semantic model and report development. These assets include Power BI Project and Template files.
This exercise should take approximately 30 minutes to complete.
Before you start
Note: You need Power BI Desktop (November 2025 or newer) installed to complete this exercise.
Open a web browser and enter the following URL to download the zip folder:
https://github.com/MicrosoftLearning/mslearn-fabric/raw/refs/heads/main/Allfiles/Labs/16b/16-reusable-assets.zip
Extract the zip file to the C:\Users\Student\Downloads\16-reusable-assets folder.
Create a new Power BI project
In this task, you’ll save a report as a Power BI Project file (.pbip). Power BI Project files store the report and semantic model details in flat files that work with source control. You might use Visual Studio Code to modify these files or Git to track changes.
-
Open the 16-Starter-Sales Analysis.pbix file within the 16-reusable-assets folder.
-
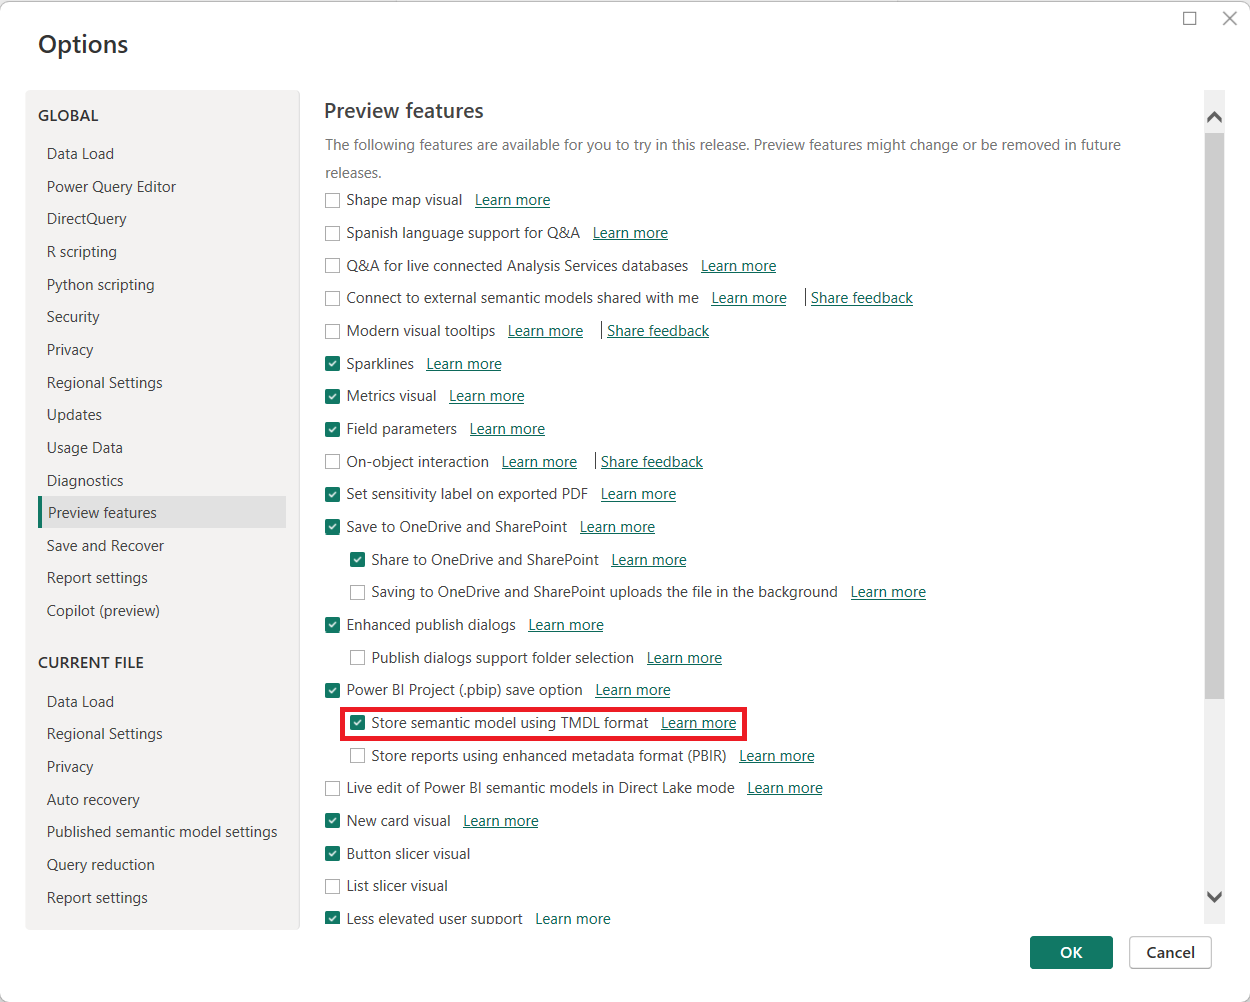
Select File > Options and settings > Options > Preview features and select the Store semantic model using TMDL format option and OK.
This enables the option to save the semantic model using Tabular Model Definition Language (TMDL), which is currently a preview feature. If prompted to restart Power BI Desktop, do so before continuing the exercise.
-
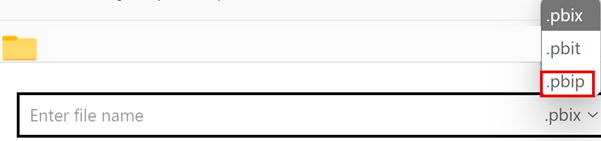
Select Save as and choose the file type by selecting the arrow in the drop-down menu when you name the file.
-
Select the .pbip file extension, then choose a name for your report, and save in a folder you will remember.
-
Notice at the top of the Power BI Desktop window that your report name has (Power BI Project) next to it.
-
Close Power BI Desktop and save your changes if prompted.
-
Reopen Power BI Desktop and open the .pbip file you just saved.
-
If prompted to Upgrade the project to use TMDL format, select Upgrade to enable the Tabular Model Definition Language format for the semantic model.
This upgrade is necessary to store the semantic model using TMDL format, which allows you to see the .tmdl files in the next steps.
-
Save your file.
Review Power BI Project file details
Let’s look at how changes in Power BI Desktop are reflected in the .tmdl files.
- From your desktop, use File explorer to navigate to the folder where you saved the .pbip file.
-
You should see the following items:
- YourReport.pbip file
- YourReport.Report folder
- YourReport.SemanticModel folder
- .gitignore Git Ignore Source File
Add a new table to your report
In this task, you’ll add a new table because the semantic model doesn’t have all of the data you need.
-
In Power BI Desktop, navigate to Get data > Web to add the new data.
-
The From Web dialog box will pop up once connected. Keep the Basic radio button selected. Enter the following file path as the URL path.
C:\Users\Student\Downloads\16-reusable-assets\us-resident-population-estimates-2020.html -
Select the box for the HTML Tables > Table 2, and then select Transform Data to proceed.
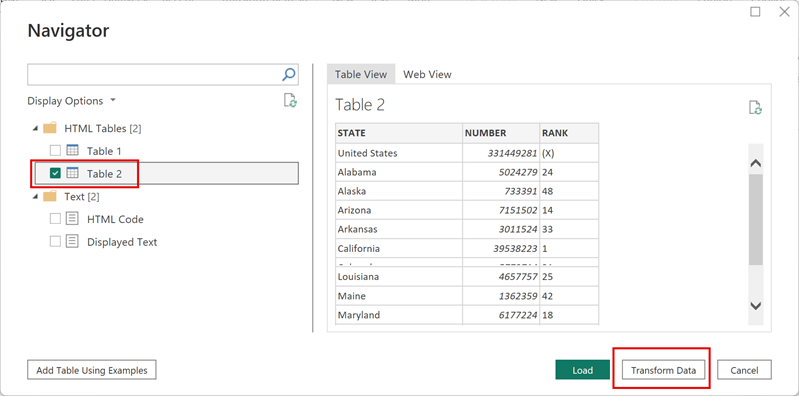
- A new Power Query Editor window will open with the Table 2 data preview.
- Rename Table 2 to US Population.
- Rename STATE to State and NUMBER to Population.
- Remove the RANK column.
- Select Close & Apply to load the transformed data to your semantic model.
- Select OK if presented a dialog box for Potential security risk.
- Save your file.
- If prompted, Don’t upgrade to the Power BI Report enhanced format.
Create a relationship
In this task, we’ll make changes to the report in Power BI Desktop and see the changes in the flat .tmdl files.
- In File explorer, find the YourReport.SemanticModel file folder.
- Open the definition folder and notice the different files.
- Open the relationships.tmdl file in a Notepad, and notice there are 9 relationships listed. Close the file.
- Back in Power BI Desktop, navigate to the Modeling tab in the ribbon.
- Select Manage relationships and notice there are 9 relationships.
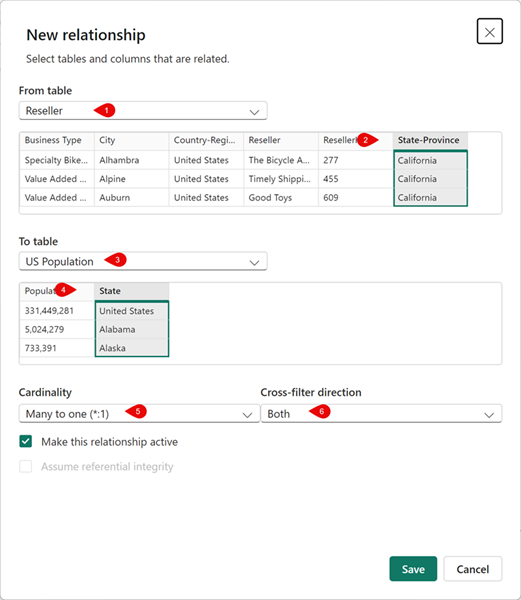
- Create a new relationship as follows:
- From: Reseller with State-Province as Key column
- To: US Population with State as Key column
- Cardinality: Many-to-one (*:1)
- Cross-filter direction: Both
- Save your file.
- Check back in the relationships.tmdl file and notice that a new relationship has been added.
These changes in flat files are trackable in source control systems, unlike .pbix files which are binary.
Add a measure and visual to your report
In this task, you’ll add a measure and visual to extend the semantic model and use the measure in a visual.
- In Power BI Desktop, navigate to the Data pane and select the Sales table.
- Select New measure on the contextual Table tools ribbon.
-
In the formula bar, enter and commit the following code:
Sales per Capita = DIVIDE( SUM(Sales[Sales]), SUM('US Population'[Population]) ) - Locate the new Sales per Capita measure and drag it onto the canvas.
-
Drag Sales | Sales, US Population | State, and US Population | Population fields to the same visual.
The labs use a shorthand notation to reference a field. It will look like this: Sales | Unit Price. In this example, Sales is the table name and Unit Price is the field name.
- Select the visual and change it to a Table.
- Notice the inconsistent formatting for the Sales per Capita and Population data.
- Select each field in the Data pane and change the format and decimal places.
- Sales per Capita: Currency | 4 decimal places
- Population: Whole number | Comma separated | 0 decimal places
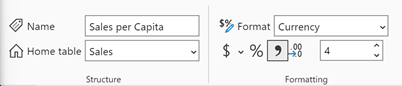
Tip: If you accidentally create a measure in the wrong table, you can easily change the Home table, as shown in the previous image.
-
Save your file.
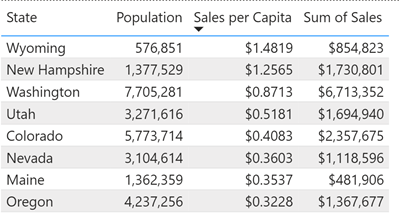
Note: Your table should look like the following image with four columns and correctly formatted numbers.
- Open Notepad
- Open the file:
C:\Users\Student\Downloads\16-Starter-Sales Analysis.SemanticModel\definition\tables\Sales.tmdl -
Locate the code around line 163 where you can observe the measure has been added like this:
measure 'Sales per Capita' = DIVIDE( SUM(Sales[Sales]), SUM('US Population'[Population]) ) formatString: \$#,0.0000;(\$#,0.0000);\$#,0.0000 lineageTag: c95a1828-af50-484b-8310-64614fe2504b annotation PBI_FormatHint = {"currencyCulture":"en-US"} - Close Notepad.
- Close Power BI Desktop. There is no need to save changes.
Create a reusable Power BI Template (PBIT)
The goal of this next part of the exercise is to demonstrate how Power BI templates (PBIT files) can separate report logic from data by using a Power Query parameter—in this case, a Region parameter. You will build a small report, define a parameter that controls which region’s data is loaded, and then export the report as a reusable template. When reopening the template, users can simply select a region value, and the report will automatically load the corresponding dataset, showing how templates enable scalable, standardized reporting across multiple variations of the same data model.
Explore Region Sales Data
-
Open Windows Explorer and navigating to the folder where the region data is stored. This should look like
C:\Users\student\Downloads\16-reusable-assets\data. Inside this folder, you will find two CSV files:- region-north.csv
- region-south.csv
-
Take a moment to open each file (you can use Notepad, Excel, or any text editor) and explore the contents. Observe the structure of the data, the columns available, and how the two regional datasets are similar. Notice the region north and south. This familiarity will help you understand what Power BI will load later and how the Region parameter will be used to switch between them.
Create the Power BI report and Load data
- Open Power BI Desktop, and create a blank report.
- From the Home ribbon, select Get Data and choose Text/CSV.
- Load the
C:\Users\Student\Downloads\16-reusable-assets\data\region-north.csvfile. - Select Transform Data
- Rename the query to
sales
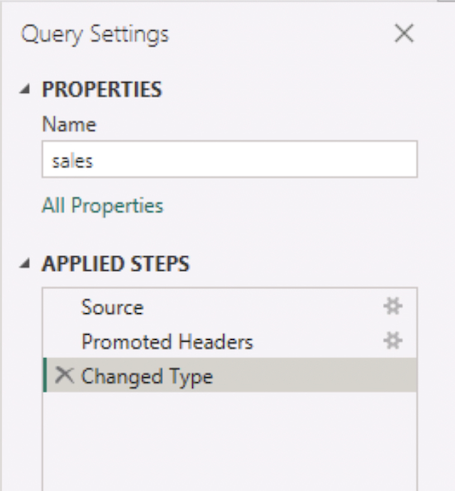
Create a Power Query Parameter
- In Power Query, from the Home ribbon, select Manage Parameters and choose New Parameter.
-
Create the parameter with the following values:
Property Value Name Region.Type Text Suggested Values List of values Table north, south Default Value north Current Value north 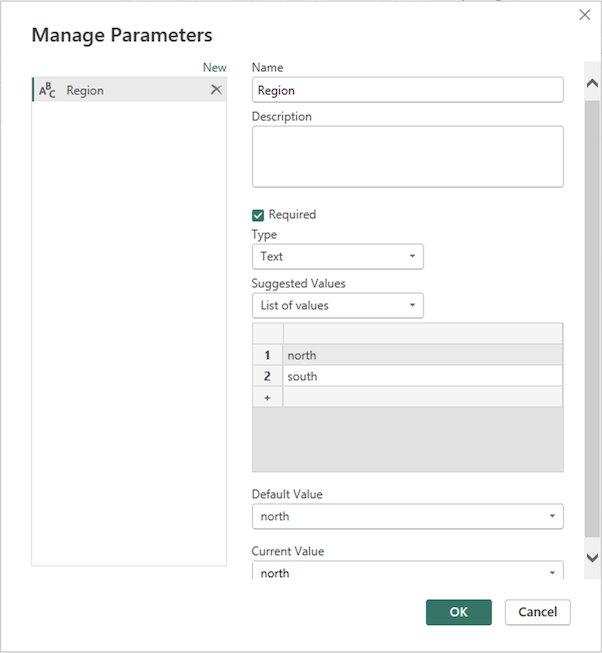
Modify Your Query to Use the Parameter
We want Power BI to allow the user to choose the region when they open the template.
- Select the sales query again.
- From the View ribbon, select Advanced Editor.
-
Notice the query is hard-coded to region-north.csv
let Source = Csv.Document(File.Contents("C:\Users\Student\Downloads\16-reusable-assets\data\region-north.csv"),[Delimiter=",", Columns=5, Encoding=1252, QuoteStyle=QuoteStyle.None]), #"Promoted Headers" = Table.PromoteHeaders(Source, [PromoteAllScalars=true]), #"Changed Type" = Table.TransformColumnTypes(#"Promoted Headers",{ {"Date", type date}, {"Region", type text}, {"Product", type text}, {"Units", Int64.Type}, {"Revenue", Int64.Type} }) in #"Changed Type" -
Replace the hard-coded region (north) with the parameter Region.
let Source = Csv.Document(File.Contents("C:\Users\Student\Downloads\16-reusable-assets\data\region-" & Region & ".csv"),[Delimiter=",", Columns=5, Encoding=1252, QuoteStyle=QuoteStyle.None]), #"Promoted Headers" = Table.PromoteHeaders(Source, [PromoteAllScalars=true]), #"Changed Type" = Table.TransformColumnTypes(#"Promoted Headers",{ {"Date", type date}, {"Region", type text}, {"Product", type text}, {"Units", Int64.Type}, {"Revenue", Int64.Type} }) in #"Changed Type"Note: In Power Query (M language), text values must be enclosed in quotation marks “ “, and you combine (concatenate) text pieces using the ampersand & operator.
- Select Close & Apply from the Home ribbon.
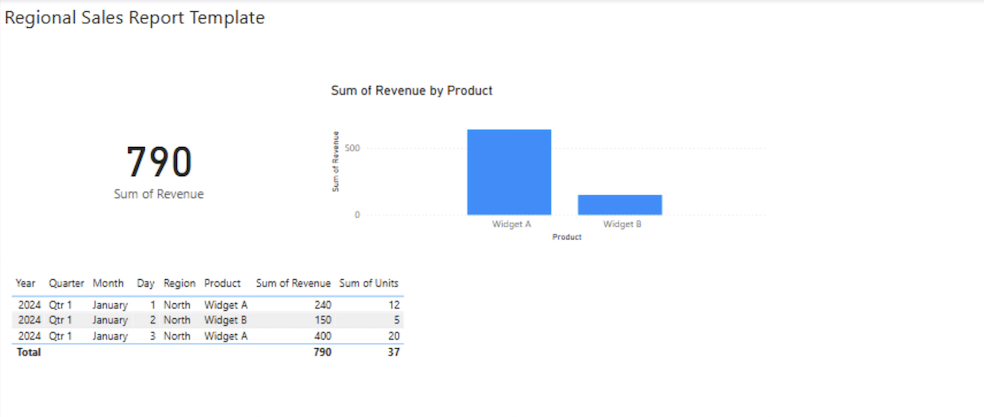
Create a simple report
- Go back to the report view.
- Create:
- A Card showing total Revenue
- A Column Chart showing Revenue by Product
- A Table showing all fields
- Add a title:
Regional Sales Report Template
The report could look like this. Don’t worry about the layout.
Save as a Template (PBIT)
- From the Home ribbon, select File > Save as.
- Select a folder location (for example Downloads), and enter a file name. For example
regional-sales. -
Choose PBIT as the file extension.

-
When asked to provide a template description, enter the following text:
Select your region.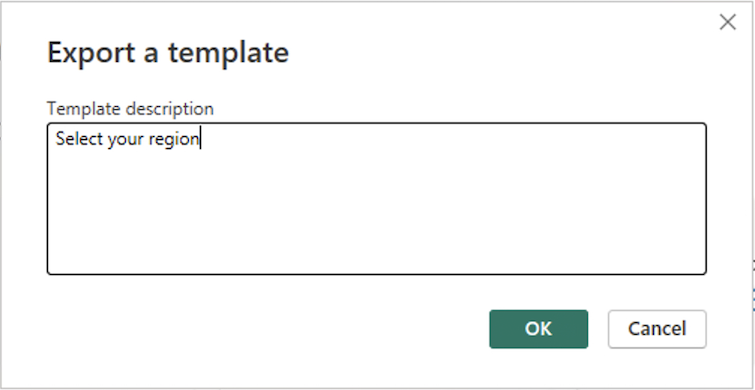
Test the template
- Close Power BI Desktop. When asked to save your changes, choose Don’t save.
-
Open the
regional-sales.pbitfile.Note: If prompted to sign in, use your Microsoft organizational account credentials. If you see a privacy levels dialog, select Ignore Privacy Levels checks for this file and select Save.
-
Notice you will get a parameter prompt asking you to select your region.
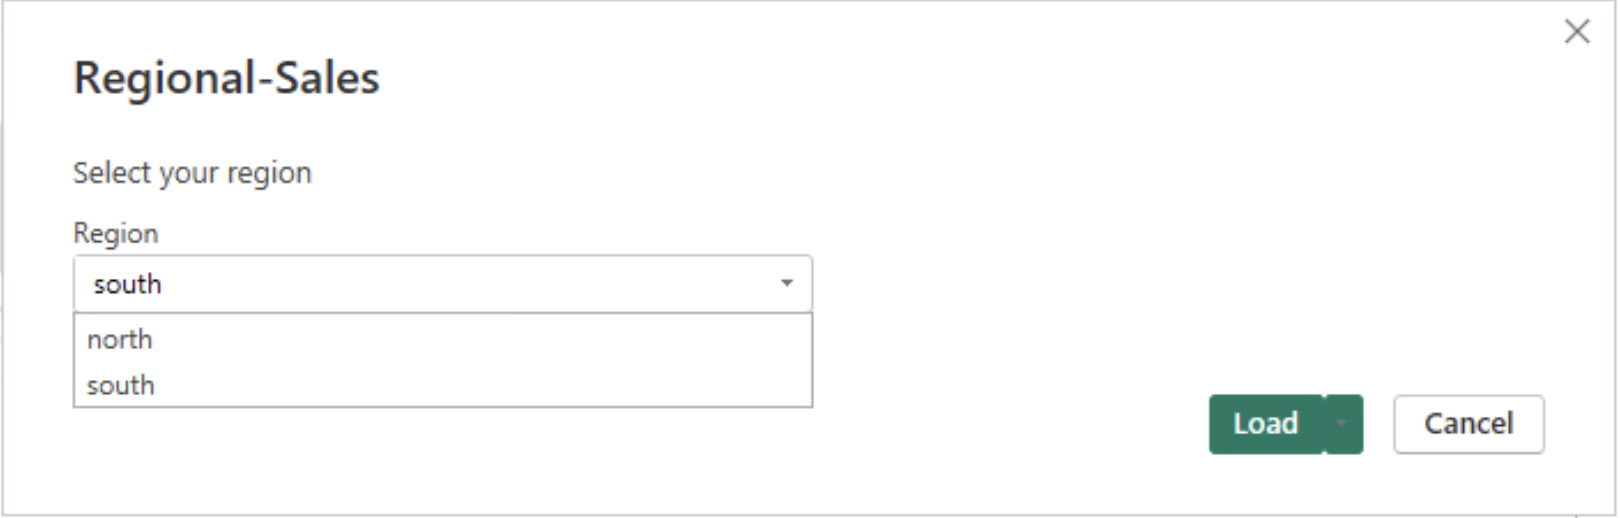
- Choose south from the dropdown list.
- Select Load to load the data and open the report.
Notice how the report opens correctly the south-region values.
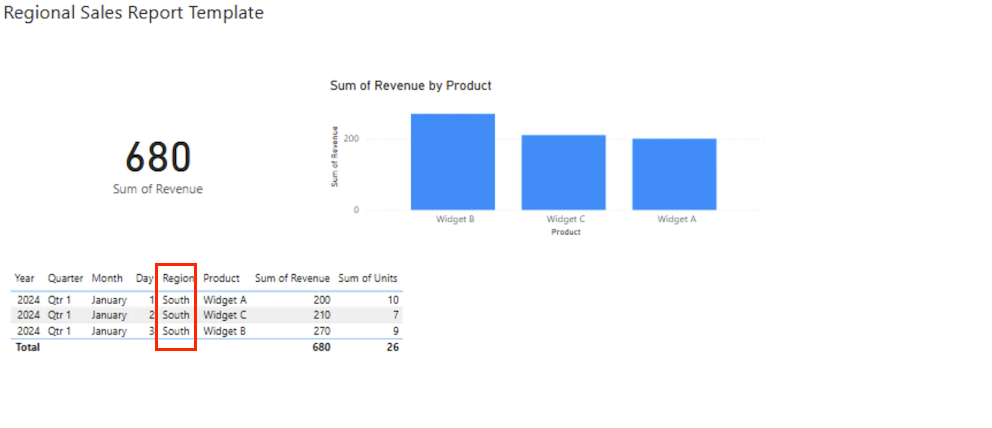
You now have a fully reusable, parameterized reporting framework.
- Close the report, you don’t need to save it.
Clean up
You’ve successfully completed this exercise. You created Power BI Project and Template files. You can safely delete the workspace and all local assets.