Work with data in a Microsoft Fabric eventhouse
In Microsoft Fabric, an eventhouse is used to store real-time data related to events; often captured from a streaming data source by an eventstream.
Within an eventhouse, the data is stored in one or more KQL databases, each of which contains tables and other objects that you can query by using Kusto Query Language (KQL) or a subset of Structured Query Language (SQL).
In this exercise, you’ll create and populate an eventhouse with some sample data related to taxi rides, and then query the data using KQL and SQL.
This exercise takes approximately 25 minutes to complete.
Create a workspace
Note: You need access to a Fabric paid or trial capacity to complete this exercise. For information about the free Fabric trial, see Fabric trial.
- Navigate to the Microsoft Fabric home page at
https://app.fabric.microsoft.com/home?experience=fabricin a browser and sign in with your Fabric credentials. - In the menu bar on the left, select Workspaces (the icon looks similar to 🗇).
- Create a new workspace with a name of your choice, selecting a licensing mode that includes Fabric capacity (Trial, Premium, or Fabric).
-
When your new workspace opens, it should be empty.

Create an Eventhouse
Now that you have a workspace with support for a Fabric capacity, you can create an eventhouse in it.
- In the menu bar on the left, select Workloads. Then, select the Real-Time Intelligence tile.
-
On the Real-Time Intelligence home page, select the Explore Real-Time Intelligence Sample tile. It will automatically create an eventhouse called RTISample:
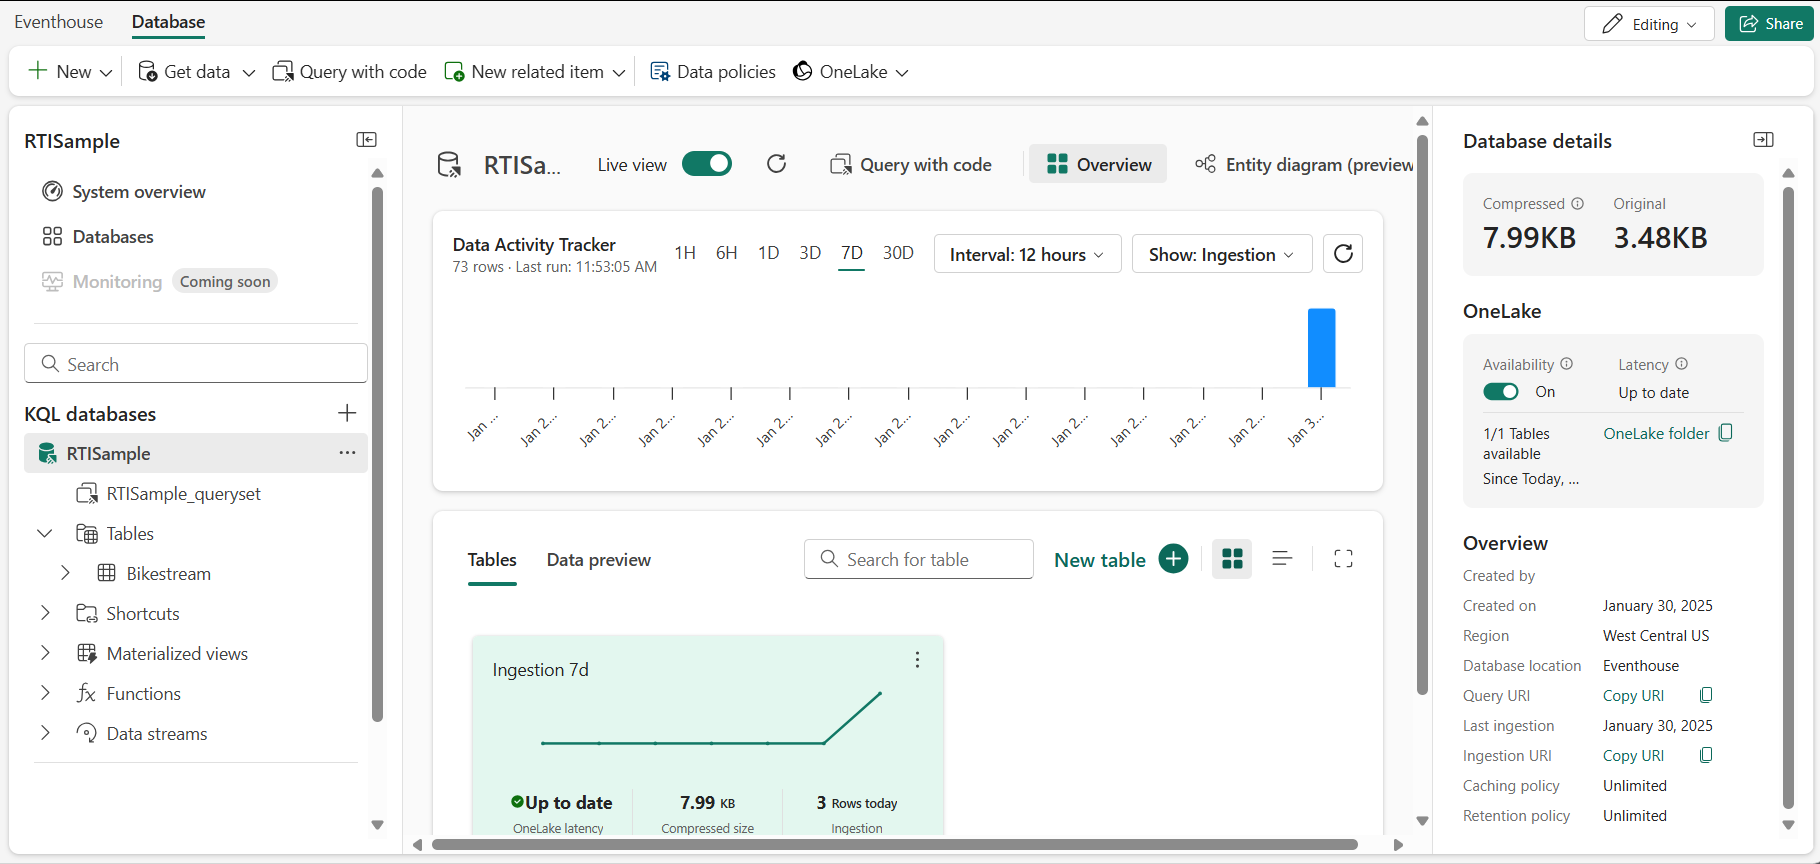
- In the pane on the left, note that your eventhouse contains a KQL database with the same name as the eventhouse.
- Verify that a Bikestream table has also been created.
Query data by using KQL
Kusto Query Language (KQL) is an intuitive, comprehensive language that you can use to query a KQL database.
Retrieve data from a table with KQL
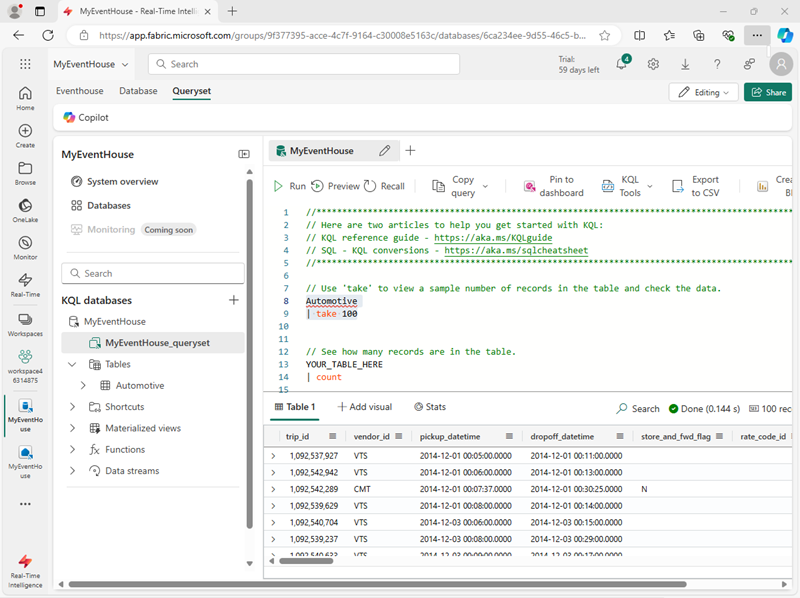
- In the left pane of the eventhouse window, under your KQL database, select the default queryset file. This file contains some sample KQL queries to get you started.
-
Modify the first example query as follows.
 Bikestream
 | take 100
NOTE: The Pipe ( | ) character is used for two purposes in KQL including to separate query operators in a tabular expression statement. It is also used as a logical OR operator within square or round brackets to denote that you may specify one of the items separated by the pipe character.
-
Select the query code and run it to return 100 rows from the table.
You can be more precise by adding specific attributes you want to query using the
projectkeyword and then using thetakekeyword to tell the engine how many records to return. -
Type, select, and run the following query:
 // Use 'project' and 'take' to view a sample number of records in the table and check the data.
 Bikestream
 | project Street, No_Bikes
 | take 10
NOTE: The use of // denotes a comment.
Another common practice in the analysis is renaming columns in our queryset to make them more user-friendly.
-
Try the following query:
 Bikestream
 | project Street, ["Number of Empty Docks"] = No_Empty_Docks
 | take 10
Summarize data by using KQL
You can use the summarize keyword with a function to aggregate and otherwise manipulate data.
-
Try the following query, which uses the sum function to summarize the rental data to see how many bikes are available in total:
 Bikestream
 | summarize ["Total Number of Bikes"] = sum(No_Bikes)
You can group the summarized data by a specified column or expression.
-
Run the following query to group the number of bikes by neighbourhood to determine the amount of available bikes in each neighbourhood:
 Bikestream
 | summarize ["Total Number of Bikes"] = sum(No_Bikes) by Neighbourhood
 | project Neighbourhood, ["Total Number of Bikes"]
If any of the bike points has a null or empty entry for neighbourhood, the results of summarization will include a blank value, which is never good for analysis.
-
Modify the query as shown here to use the case function along with the isempty and isnull functions to group all trips for which the neighbourhood is unknown into a Unidentified category for follow-up.
Bikestream | summarize ["Total Number of Bikes"] = sum(No_Bikes) by Neighbourhood | project Neighbourhood = case(isempty(Neighbourhood) or isnull(Neighbourhood), "Unidentified", Neighbourhood), ["Total Number of Bikes"]Note: As this sample dataset is well-maintained, you might not have an Unidentified field in the query result.
Sort data by using KQL
To make more sense of our data, we typically order it by a column, and this process is done in KQL with either a sort by or order by operator (they act the same way).
-
Try the following query:
Bikestream | summarize ["Total Number of Bikes"] = sum(No_Bikes) by Neighbourhood | project Neighbourhood = case(isempty(Neighbourhood) or isnull(Neighbourhood), "Unidentified", Neighbourhood), ["Total Number of Bikes"] | sort by Neighbourhood asc -
Modify the query as follows and run it again, and note that the order by operator works the same way as sort by:
 Bikestream
 | summarize ["Total Number of Bikes"] = sum(No_Bikes) by Neighbourhood
 | project Neighbourhood = case(isempty(Neighbourhood) or isnull(Neighbourhood), "Unidentified", Neighbourhood), ["Total Number of Bikes"]
 | order by Neighbourhood asc
Filter data by using KQL
In KQL, the where clause is used to filter data. You can combine conditions in a where clause by using and and or logical operators.
-
Run the following query to filter the bike data to include only bike points in the Chelsea neighbourhood:
 Bikestream
 | where Neighbourhood == "Chelsea"
 | summarize ["Total Number of Bikes"] = sum(No_Bikes) by Neighbourhood
 | project Neighbourhood = case(isempty(Neighbourhood) or isnull(Neighbourhood), "Unidentified", Neighbourhood), ["Total Number of Bikes"]
 | sort by Neighbourhood asc
Query data by using Transact-SQL
KQL Database doesn’t support Transact-SQL natively, but it provides a T-SQL endpoint that emulates Microsoft SQL Server and allows you to run T-SQL queries on your data. The T-SQL endpoint has some limitations and differences from the native SQL Server. For example, it doesn’t support creating, altering, or dropping tables, or inserting, updating, or deleting data. It also doesn’t support some T-SQL functions and syntax that aren’t compatible with KQL. It was created to allow systems that didn’t support KQL to use T-SQL to query the data within a KQL Database. So, it’s recommended to use KQL as the primary query language for KQL Database, as it offers more capabilities and performance than T-SQL. You can also use some SQL functions that are supported by KQL, such as count, sum, avg, min, max, and so on.
Retrieve data from a table by using Transact-SQL
-
In your queryset, add and run the following Transact-SQL query:
SELECT TOP 100 * from Bikestream -
Modify the query as follows to retrieve specific columns
SELECT TOP 10 Street, No_Bikes FROM Bikestream -
Modify the query to assign an alias that renames No_Empty_Docks to a more user-friendly name.
 SELECT TOP 10 Street, No_Empty_Docks as [Number of Empty Docks]
 from Bikestream
Summarize data by using Transact-SQL
-
Run the following query to find the total number of bikes available:
SELECT sum(No_Bikes) AS [Total Number of Bikes] FROM Bikestream -
Modify the query to group the total number of bikes by neighbourhood:
SELECT Neighbourhood, Sum(No_Bikes) AS [Total Number of Bikes] FROM Bikestream GROUP BY Neighbourhood -
Modify the query further to use a CASE statement to group bike points with an unknown origin into a Unidentified category for follow-up.
 SELECT CASE
          WHEN Neighbourhood IS NULL OR Neighbourhood = '' THEN 'Unidentified'
          ELSE Neighbourhood
        END AS Neighbourhood,
        SUM(No_Bikes) AS [Total Number of Bikes]
 FROM Bikestream
 GROUP BY CASE
            WHEN Neighbourhood IS NULL OR Neighbourhood = '' THEN 'Unidentified'
            ELSE Neighbourhood
          END;
Sort data by using Transact-SQL
-
Run the following query to order the grouped results by neighbourhood:
 SELECT CASE
          WHEN Neighbourhood IS NULL OR Neighbourhood = '' THEN 'Unidentified'
          ELSE Neighbourhood
        END AS Neighbourhood,
        SUM(No_Bikes) AS [Total Number of Bikes]
 FROM Bikestream
 GROUP BY CASE
            WHEN Neighbourhood IS NULL OR Neighbourhood = '' THEN 'Unidentified'
            ELSE Neighbourhood
          END
 ORDER BY Neighbourhood ASC;
Filter data by using Transact-SQL
-
Run the following query to filter the grouped data so that only rows having a neighbourhood of “Chelsea” are included in the results
 SELECT CASE
          WHEN Neighbourhood IS NULL OR Neighbourhood = '' THEN 'Unidentified'
          ELSE Neighbourhood
        END AS Neighbourhood,
        SUM(No_Bikes) AS [Total Number of Bikes]
 FROM Bikestream
 GROUP BY CASE
            WHEN Neighbourhood IS NULL OR Neighbourhood = '' THEN 'Unidentified'
            ELSE Neighbourhood
          END
 HAVING Neighbourhood = 'Chelsea'
 ORDER BY Neighbourhood ASC;
Clean up resources
In this exercise, you have created an eventhouse and queried data using KQL and SQL.
When you’ve finished exploring your KQL database, you can delete the workspace you created for this exercise.
- In the bar on the left, select the icon for your workspace.
- In the toolbar, select Workspace settings.
- In the General section, select Remove this workspace.