Get started with Real-Time Analytics in Microsoft Fabric
Microsoft Fabric provides a runtime that you can use to store and query data by using Kusto Query Language (KQL). Kusto is optimized for data that includes a time series component, such as real-time data from log files or IoT devices.
This lab takes approximately 30 minutes to complete.
Note: You need a Microsoft Fabric trial to complete this exercise.
Create a workspace
Before working with data in Fabric, create a workspace with the Fabric trial enabled.
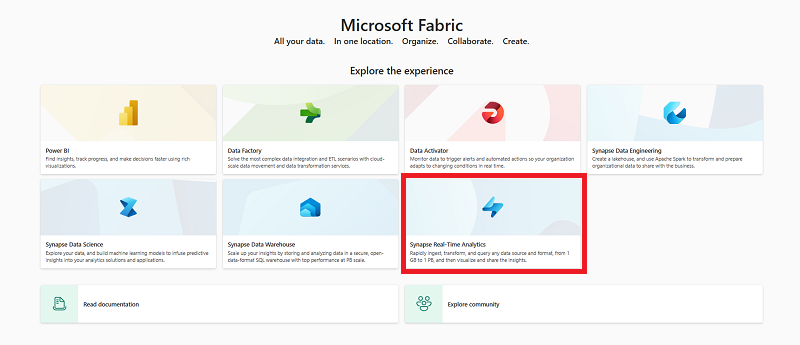
- On the Microsoft Fabric home page, select Synapse Real-Time Analytics.
- In the menu bar on the left, select Workspaces (the icon looks similar to 🗇).
- Create a new workspace with a name of your choice, selecting a licensing mode that includes Fabric capacity (Trial, Premium, or Fabric).
-
When your new workspace opens, it should be empty.

Download file for KQL database
Now that you have a workspace, it’s time to download the data file you’re going to analyze.
- Download the data file for this exercise from https://raw.githubusercontent.com/MicrosoftLearning/dp-data/main/sales.csv, saving it as sales.csv on your local computer (or lab VM if applicable)
- Return to the browser window with the Microsoft Fabric Experience.
Create a KQL database
Kusto query language (KQL) is used to query static or streaming data in a table that is defined in a KQL database. To analyze the sales data, you must create a table in a KQL database and ingest the data from the file.
-
In the Microsoft Fabric experience portal, select the Synapse Real-Time Analytics experience image as shown here:
- On the Home page for the Real-Time Analytics experience, select KQL database and create a new database with a name of your choice.
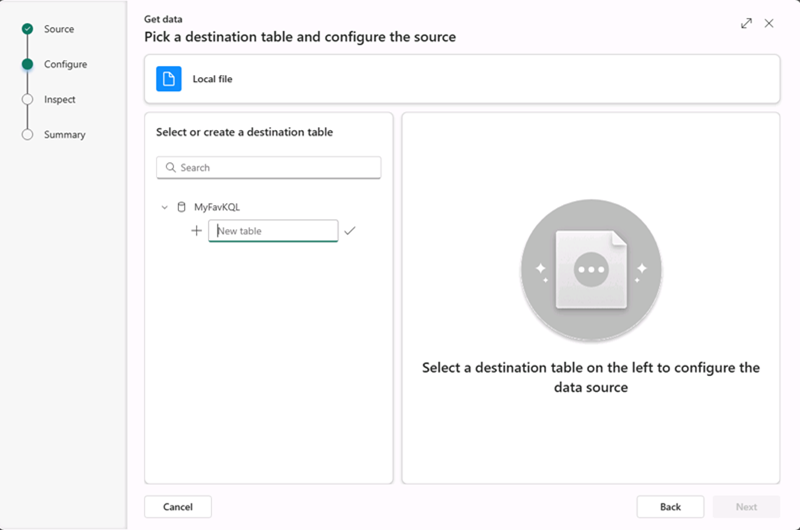
- When the new database has been created, select the option to get data from Local File. Then use the wizard to import the data into a new table by selecting the following options:
- Destination:
- Database: The database you created is already selected
- Table: Create a new table named sales by clicking on the + sign to the left of New table
- Youll now see the Drag files here or a Browse for files hyperlink appear in the same window.
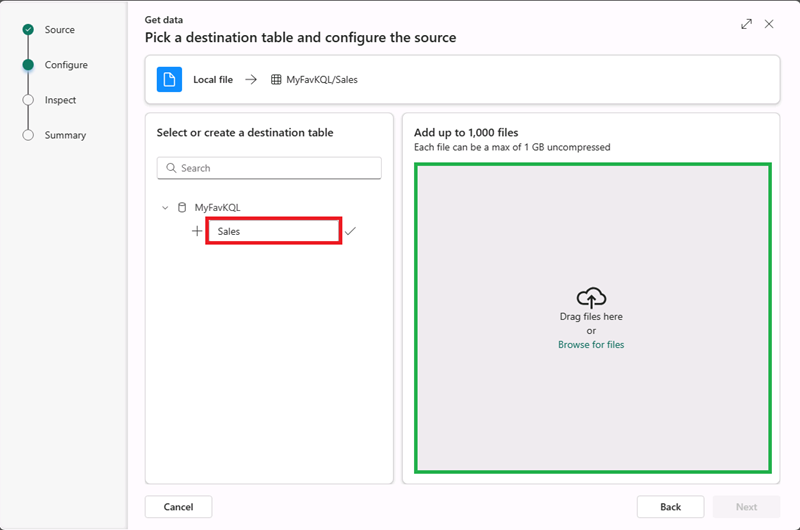
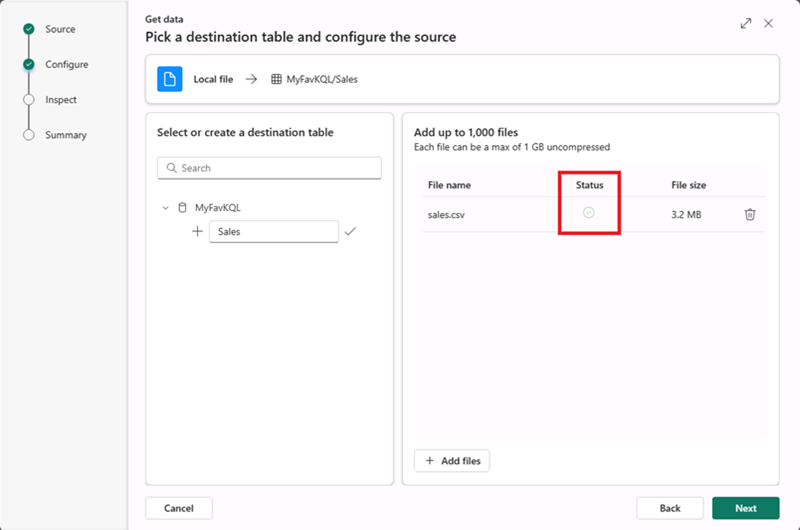
- browse or drag your sales.csv onto the screen and wait for the Status box to change to a green check box and then select Next
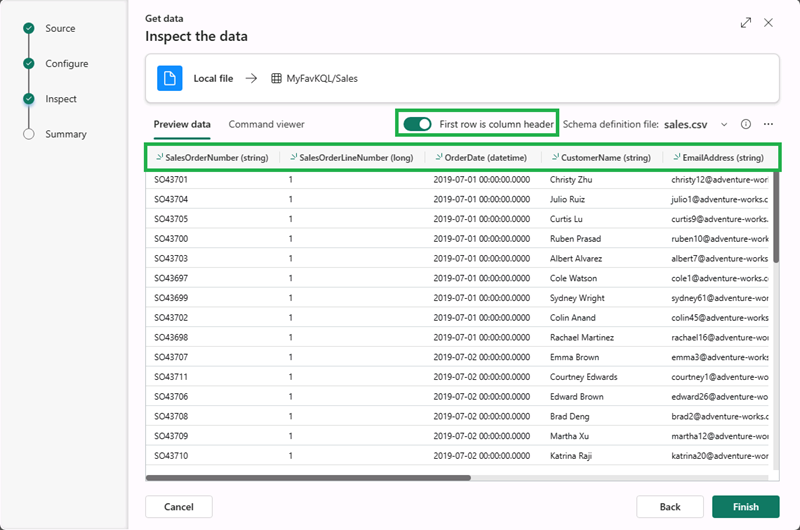
- In this screen you’ll see that your column headings are in teh first row although the system detected them, we still need to move the slider above these lines First row is column header in order to get keep from getting any errors.
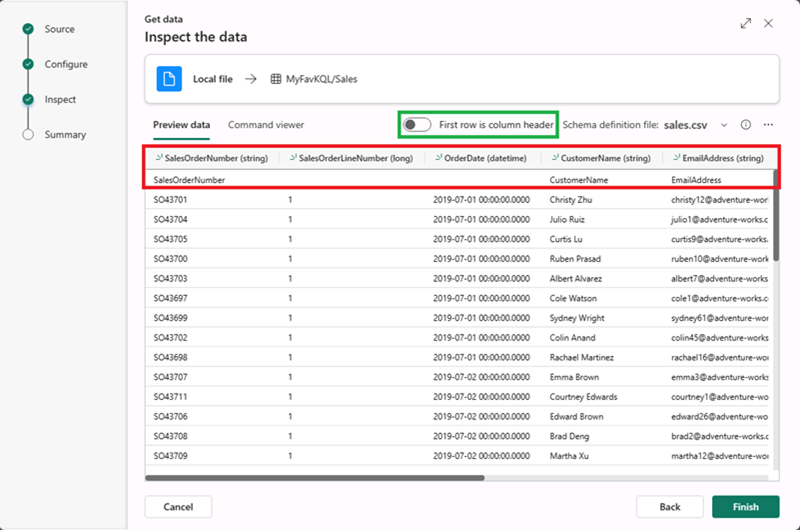
- Once you select this slider you will see everything looks good to go, select the Finish button on the bottom right of the panel.
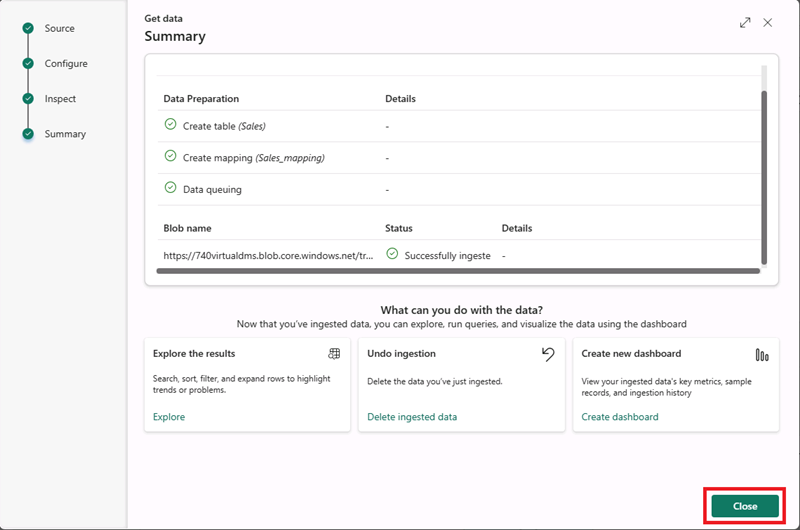
- Wait for the steps in the summary screen to complete which include:
- Create table (sales)
- create mapping (sales_mapping)
- Data queuing
- Ingestion
- Select the Close button
- Destination:
Note: In this example, you imported a very small amount of static data from a file, which is fine for the purposes of this exercise. In reality, you can use Kusto to analyze much larger volumes of data; including real-time data from a streaming source such as Azure Event Hubs.
Use KQL to query the sales table
Now that you have a table of data in your database, you can use KQL code to query it.
-
Make sure you have the sales table highlighted. From the menu bar, select the Query table drop-down, and from there select Show any 100 records .
-
A new pane will open with the query and its result.
-
Modify the query as follows:
sales | where Item == 'Road-250 Black, 48' -
Run the query. Then review the results, which should contain only the rows for sales orders for the Road-250 Black, 48 product.
-
Modify the query as follows:
sales | where Item == 'Road-250 Black, 48' | where datetime_part('year', OrderDate) > 2020 -
Run the query and review the results, which should contain only sales orders for Road-250 Black, 48 made after 2020.
-
Modify the query as follows:
sales | where OrderDate between (datetime(2020-01-01 00:00:00) .. datetime(2020-12-31 23:59:59)) | summarize TotalNetRevenue = sum(UnitPrice) by Item | sort by Item asc - Run the query and review the results, which should contain the total net revenue for each product between January 1st and December 31st 2020 in ascending order of product name.
- Select Save as KQL queryset and save the query as Revenue by Product.
Create a Power BI report from a KQL Queryset
You can use your KQL Queryset as the basis for a Power BI report.
- In the query workbench editor for your query set, run the query and wait for the results.
- Select Build Power BI report and wait for the report editor to open.
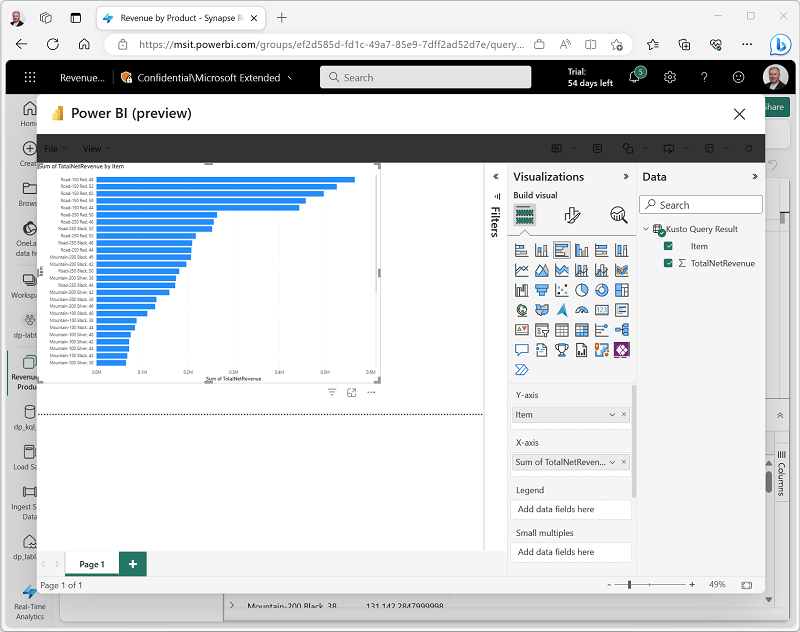
- In the report editor, in the Data pane, expand Kusto Query Result and select the Item and TotalRevenue fields.
-
On the report design canvas, select the table visualization that has been added and then in the Visualizations pane, select Clustered bar chart.
- In the Power BI window, in the File menu, select Save. Then save the report as Revenue by Item.pbix in the workspace where your lakehouse and KQL database are defined using a Non-Business sensitivity label.
-
Close the Power BI window, and in the bar on the left, select the icon for your workspace.
Refresh the Workspace page if necessary to view all of the items it contains.
- In the list of items in your workspace, note that the Revenue by Item report is listed.
Clean up resources
In this exercise, you have created a lakehouse, a KQL database to analyze the data uploaded into the lakehouse. You used KQL to query the data and create a query set, which was then used to create a Power BI report.
If you’ve finished exploring your KQL database, you can delete the workspace you created for this exercise.
- In the bar on the left, select the icon for your workspace.
- In the … menu on the toolbar, select Workspace settings.
- In the General section, select Remove this workspace.