Monitor a data warehouse in Microsoft Fabric
In Microsoft Fabric, a data warehouse provides a relational database for large-scale analytics. Data warehouses in Microsoft Fabric include dynamic management views that you can use to monitor activity and queries.
This lab will take approximately 30 minutes to complete.
Create a workspace
Note: You need access to a Fabric paid or trial capacity to complete this exercise. For information about the free Fabric trial, see Fabric trial.
- Navigate to the Microsoft Fabric home page at
https://app.fabric.microsoft.com/home?experience=fabricin a browser, and sign in with your Fabric credentials. - In the menu bar on the left, select Workspaces (the icon looks similar to 🗇).
- Create a new workspace with a name of your choice, selecting a licensing mode that includes Fabric capacity (Trial, Premium, or Fabric).
-
When your new workspace opens, it should be empty.

Create a sample data warehouse
Now that you have a workspace, it’s time to create a data warehouse.
-
On the menu bar on the left, select Create. In the New page, under the Data Warehouse section, select Sample warehouse and create a new data warehouse named sample-dw.
Note: If the Create option is not pinned to the sidebar, you need to select the ellipsis (…) option first.
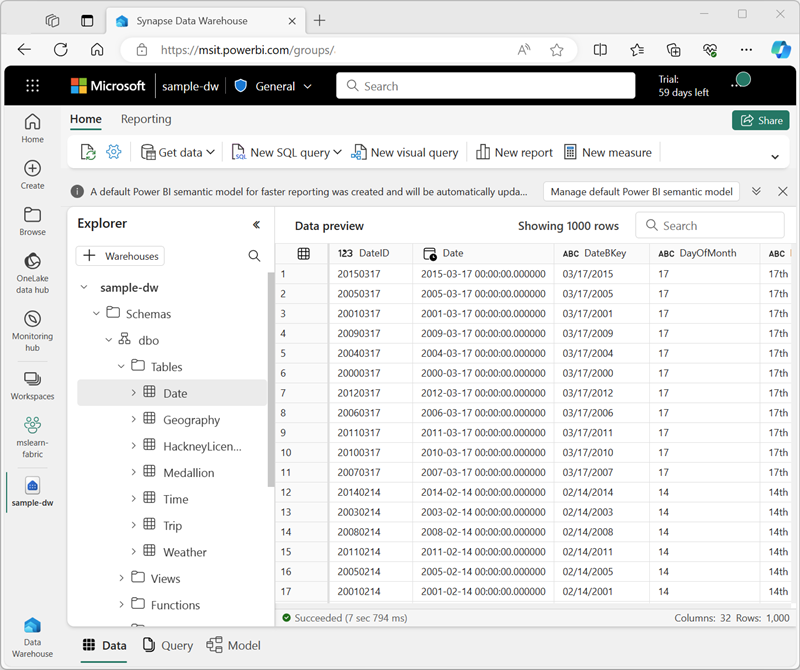
After a minute or so, a new warehouse will be created and populated with sample data for a taxi ride analysis scenario.
Explore dynamic management views
Microsoft Fabric data warehouses include dynamic management views (DMVs), which you can use to identify current activity in the data warehouse instance.
- In the sample-dw data warehouse page, in the New SQL query drop-down list, select New SQL query.
-
In the new blank query pane, enter the following Transact-SQL code to query the sys.dm_exec_connections DMV:
SELECT * FROM sys.dm_exec_connections; - Use the ▷ Run button to run the SQL script and view the results, which include details of all connections to the data warehouse.
-
Modify the SQL code to query the sys.dm_exec_sessions DMV, like this:
SELECT * FROM sys.dm_exec_sessions; - Run the modified query and view the results, which show details of all authenticated sessions.
-
Modify the SQL code to query the sys.dm_exec_requests DMV, like this:
SELECT * FROM sys.dm_exec_requests; - Run the modified query and view the results, which show details of all requests being executed in the data warehouse.
-
Modify the SQL code to join the DMVs and return information about currently running requests in the same database, like this:
SELECT connections.connection_id, sessions.session_id, sessions.login_name, sessions.login_time, requests.command, requests.start_time, requests.total_elapsed_time FROM sys.dm_exec_connections AS connections INNER JOIN sys.dm_exec_sessions AS sessions ON connections.session_id=sessions.session_id INNER JOIN sys.dm_exec_requests AS requests ON requests.session_id = sessions.session_id WHERE requests.status = 'running' AND requests.database_id = DB_ID() ORDER BY requests.total_elapsed_time DESC; - Run the modified query and view the results, which show details of all running queries in the database (including this one).
-
In the New SQL query drop-down list, select New SQL query to add a second query tab. Then in the new empty query tab, run the following code:
WHILE 1 = 1 SELECT * FROM Trip; - Leave the query running, and return to the tab containing the code to query the DMVs and re-run it. This time, the results should include the second query that is running in the other tab. Note the elapsed time for that query.
- Wait a few seconds and re-run the code to query the DMVs again. The elapsed time for the query in the other tab should have increased.
- Return to the second query tab where the query is still running and select Cancel to cancel it.
- Back on the tab with the code to query the DMVs, re-run the query to confirm that the second query is no longer running.
- Close all query tabs.
Further Information: See Monitor connections, sessions, and requests using DMVs in the Microsoft Fabric documentation for more information about using DMVs.
Explore query insights
Microsoft Fabric data warehouses provide query insights - a special set of views that provide details about the queries being run in your data warehouse.
- In the sample-dw data warehouse page, in the New SQL query drop-down list, select New SQL query.
-
In the new blank query pane, enter the following Transact-SQL code to query the exec_requests_history view:
SELECT * FROM queryinsights.exec_requests_history; - Use the ▷ Run button to run the SQL script and view the results, which include details of previously executed queries.
-
Modify the SQL code to query the frequently_run_queries view, like this:
SELECT * FROM queryinsights.frequently_run_queries; - Run the modified query and view the results, which show details of frequently run queries.
-
Modify the SQL code to query the long_running_queries view, like this:
SELECT * FROM queryinsights.long_running_queries; - Run the modified query and view the results, which show details of all queries and their durations.
Further Information: See Query insights in Fabric data warehousing in the Microsoft Fabric documentation for more information about using query insights.
Clean up resources
In this exercise, you have used dynamic management views and query insights to monitor activity in a Microsoft Fabric data warehouse.
If you’ve finished exploring your data warehouse, you can delete the workspace you created for this exercise.
- In the bar on the left, select the icon for your workspace to view all of the items it contains.
- Select Workspace settings and in the General section, scroll down and select Remove this workspace.
- Select Delete to delete the workspace.