Load data into a warehouse using T-SQL
In Microsoft Fabric, a data warehouse provides a relational database for large-scale analytics. Unlike the default read-only SQL endpoint for tables defined in a lakehouse, a data warehouse provides full SQL semantics; including the ability to insert, update, and delete data in the tables.
This lab will take approximately 30 minutes to complete.
Create a workspace
Note: You need access to a Fabric paid or trial capacity to complete this exercise. For information about the free Fabric trial, see Fabric trial.
- Navigate to the Microsoft Fabric home page at
https://app.fabric.microsoft.com/home?experience=fabricin a browser, and sign in with your Fabric credentials. - In the menu bar on the left, select Workspaces (the icon looks similar to 🗇).
- Create a new workspace with a name of your choice, selecting a licensing mode that includes Fabric capacity (Trial, Premium, or Fabric).
-
When your new workspace opens, it should be empty.

Create a lakehouse and upload files
In our scenario, since we don’t have any available data, we must ingest data to be used for loading the warehouse. You’ll create a data lakehouse for the data files you’re going to use to load the warehouse.
-
Select + New item and create a new Lakehouse with a name of your choice.
After a minute or so, a new empty lakehouse will be created. You need to ingest some data into the data lakehouse for analysis. There are multiple ways to do this, but in this exercise you’ll download a CSV file to your local computer (or lab VM if applicable) and then upload it to your lakehouse.
-
Download the file for this exercise from
https://github.com/MicrosoftLearning/dp-data/raw/main/sales.csv. -
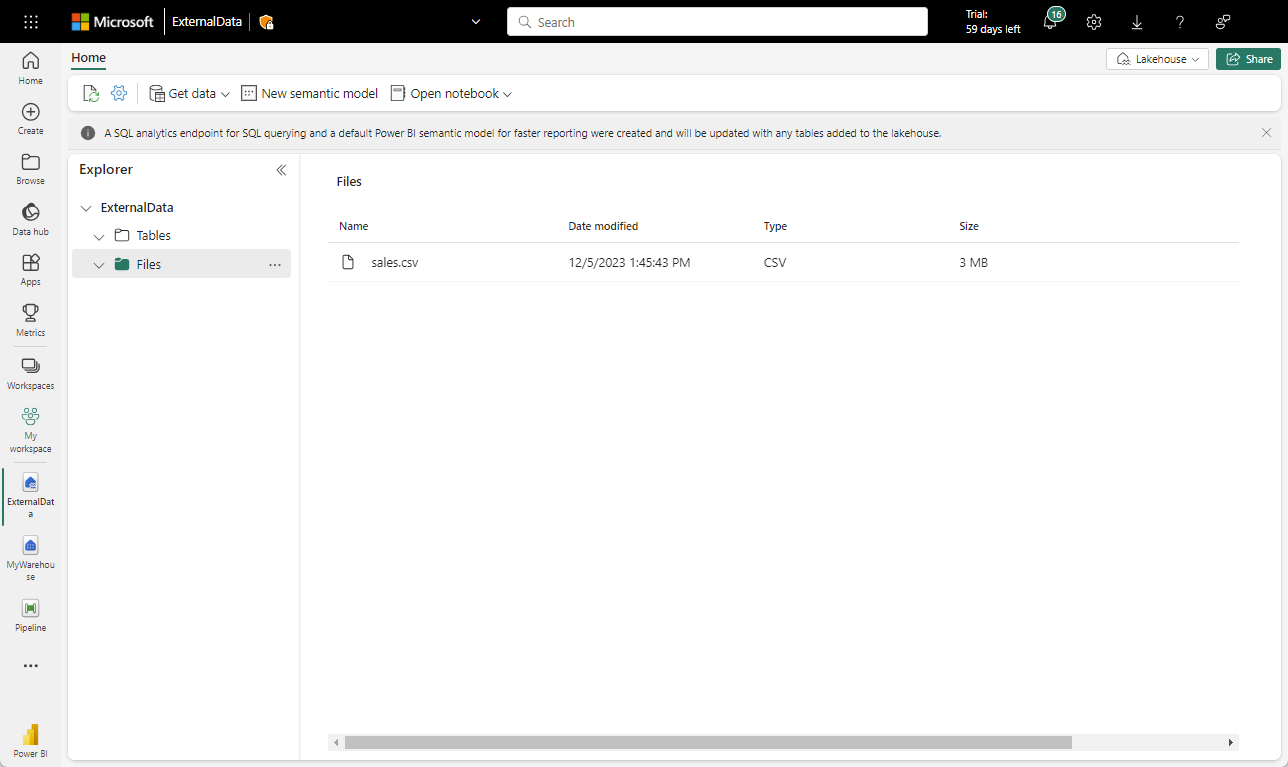
Return to the web browser tab containing your lakehouse, and in the … menu for the Files folder in the Explorer pane, select Upload and Upload files, and then upload the sales.csv file from your local computer (or lab VM if applicable) to the lakehouse.
-
After the files have been uploaded, select Files. Verify that the CSV file has been uploaded, as shown here:
Create a table in the lakehouse
-
In the … menu for the sales.csv file in the Explorer pane, select Load to tables, and then New table.
- Provide the following information in the Load file to new table dialog.
- New table name: staging_sales
- Use header for columns names: Selected
- Separator: ,
- Select Load.
Create a warehouse
Now that you have a workspace, a lakehouse, and the sales table with the data you need, it’s time to create a data warehouse.
-
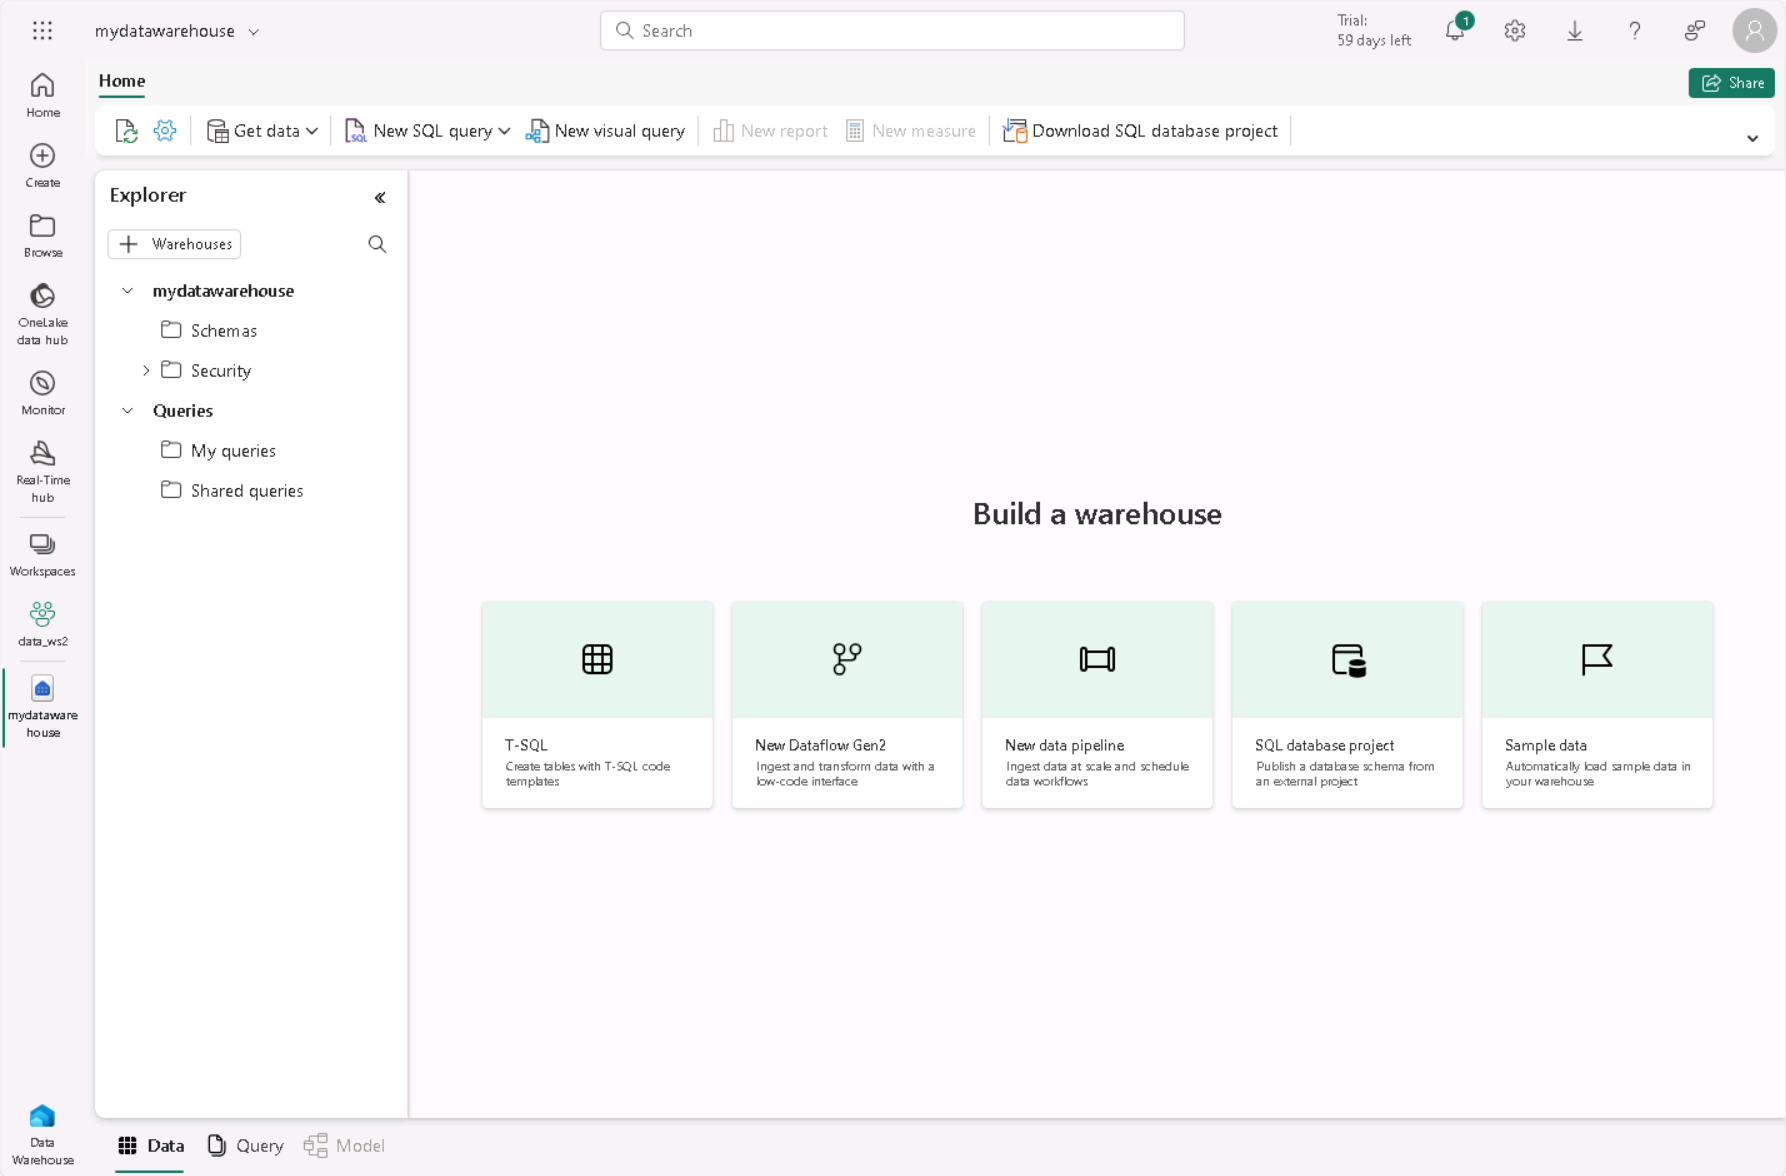
On the menu bar on the left, select Create. In the New page, under the Data Warehouse section, select Warehouse. Give it a unique name of your choice.
Note: If the Create option is not pinned to the sidebar, you need to select the ellipsis (…) option first.
After a minute or so, a new warehouse will be created:
Create fact table, dimensions and view
Let’s create the fact tables and dimensions for the Sales data. You’ll also create a view pointing to a lakehouse, this simplifies the code in the stored procedure we’ll use to load.
-
From your workspace, select the warehouse you created.
-
In the warehouse toolbar, select New SQL query, then copy and run the following query.
 CREATE SCHEMA [Sales]
 GO

 IF OBJECT_ID('Sales.Fact_Sales', 'U') IS NULL
 	CREATE TABLE Sales.Fact_Sales (
 		CustomerID VARCHAR(255) NOT NULL,
 		ItemID VARCHAR(255) NOT NULL,
 		SalesOrderNumber VARCHAR(30),
 		SalesOrderLineNumber INT,
 		OrderDate DATE,
 		Quantity INT,
 		TaxAmount FLOAT,
 		UnitPrice FLOAT
 	);

 IF OBJECT_ID('Sales.Dim_Customer', 'U') IS NULL
     CREATE TABLE Sales.Dim_Customer (
         CustomerID VARCHAR(255) NOT NULL,
         CustomerName VARCHAR(255) NOT NULL,
         EmailAddress VARCHAR(255) NOT NULL
     );

 ALTER TABLE Sales.Dim_Customer add CONSTRAINT PK_Dim_Customer PRIMARY KEY NONCLUSTERED (CustomerID) NOT ENFORCED
 GO

 IF OBJECT_ID('Sales.Dim_Item', 'U') IS NULL
     CREATE TABLE Sales.Dim_Item (
         ItemID VARCHAR(255) NOT NULL,
         ItemName VARCHAR(255) NOT NULL
     );

 ALTER TABLE Sales.Dim_Item add CONSTRAINT PK_Dim_Item PRIMARY KEY NONCLUSTERED (ItemID) NOT ENFORCED
 GO
Important: In a data warehouse, foreign key constraints are not always necessary at the table level. While foreign key constraints can help ensure data integrity, they can also add overhead to the ETL (Extract, Transform, Load) process and slow down data loading. The decision to use foreign key constraints in a data warehouse should be based on a careful consideration of the trade-offs between data integrity and performance.
-
In the Explorer, navigate to Schemas » Sales » Tables. Note the Fact_Sales, Dim_Customer, and Dim_Item tables you just created.
Note: If you can’t see the new schemas, open the … menu for Tables in the Explorer pane, then select Refresh.
-
Open a new New SQL query editor, then copy and run the following query. Update <your lakehouse name> with the lakehouse you created.
CREATE VIEW Sales.Staging_Sales AS SELECT * FROM [<your lakehouse name>].[dbo].[staging_sales]; -
In the Explorer, navigate to Schemas » Sales » Views. Note the Staging_Sales view you created.
Load data to the warehouse
Now that the fact and dimensions tables are created, let’s create a stored procedure to load the data from our lakehouse into the warehouse. Because of the automatic SQL endpoint created when we create the lakehouse, you can directly access the data in your lakehouse from the warehouse using T-SQL and cross-database queries.
For the sake of simplicity in this case study, you’ll use the customer name and item name as the primary keys.
-
Create a new New SQL query editor, then copy and run the following query.
CREATE OR ALTER PROCEDURE Sales.LoadDataFromStaging (@OrderYear INT) AS BEGIN -- Load data into the Customer dimension table INSERT INTO Sales.Dim_Customer (CustomerID, CustomerName, EmailAddress) SELECT DISTINCT CustomerName, CustomerName, EmailAddress FROM [Sales].[Staging_Sales] WHERE YEAR(OrderDate) = @OrderYear AND NOT EXISTS ( SELECT 1 FROM Sales.Dim_Customer WHERE Sales.Dim_Customer.CustomerName = Sales.Staging_Sales.CustomerName AND Sales.Dim_Customer.EmailAddress = Sales.Staging_Sales.EmailAddress ); -- Load data into the Item dimension table INSERT INTO Sales.Dim_Item (ItemID, ItemName) SELECT DISTINCT Item, Item FROM [Sales].[Staging_Sales] WHERE YEAR(OrderDate) = @OrderYear AND NOT EXISTS ( SELECT 1 FROM Sales.Dim_Item WHERE Sales.Dim_Item.ItemName = Sales.Staging_Sales.Item ); -- Load data into the Sales fact table INSERT INTO Sales.Fact_Sales (CustomerID, ItemID, SalesOrderNumber, SalesOrderLineNumber, OrderDate, Quantity, TaxAmount, UnitPrice) SELECT CustomerName, Item, SalesOrderNumber, CAST(SalesOrderLineNumber AS INT), CAST(OrderDate AS DATE), CAST(Quantity AS INT), CAST(TaxAmount AS FLOAT), CAST(UnitPrice AS FLOAT) FROM [Sales].[Staging_Sales] WHERE YEAR(OrderDate) = @OrderYear; END -
Create a new New SQL query editor, then copy and run the following query.
EXEC Sales.LoadDataFromStaging 2021Note: In this case, we are only loading data from the year 2021. However, you have the option to modify it to load data from previous years.
Run analytical queries
Let’s run some analytical queries to validate the data in the warehouse.
-
On the top menu, select New SQL query, then copy and run the following query.
 SELECT c.CustomerName, SUM(s.UnitPrice * s.Quantity) AS TotalSales
 FROM Sales.Fact_Sales s
 JOIN Sales.Dim_Customer c
 ON s.CustomerID = c.CustomerID
 WHERE YEAR(s.OrderDate) = 2021
 GROUP BY c.CustomerName
 ORDER BY TotalSales DESC;
Note: This query shows the customers by total sales for the year of 2021. The customer with the highest total sales for the specified year is Jordan Turner, with total sales of 14686.69.
-
On the top menu, select New SQL query or reuse the same editor, then copy and run the following query.
 SELECT i.ItemName, SUM(s.UnitPrice * s.Quantity) AS TotalSales
 FROM Sales.Fact_Sales s
 JOIN Sales.Dim_Item i
 ON s.ItemID = i.ItemID
 WHERE YEAR(s.OrderDate) = 2021
 GROUP BY i.ItemName
 ORDER BY TotalSales DESC;
Note: This query shows the top-seliing items by total sales for the year of 2021. These results suggest that the Mountain-200 bike model, in both black and silver colors, was the most popular item among customers in 2021.
-
On the top menu, select New SQL query or reuse the same editor, then copy and run the following query.
 WITH CategorizedSales AS (
 SELECT
     CASE
         WHEN i.ItemName LIKE '%Helmet%' THEN 'Helmet'
         WHEN i.ItemName LIKE '%Bike%' THEN 'Bike'
         WHEN i.ItemName LIKE '%Gloves%' THEN 'Gloves'
         ELSE 'Other'
     END AS Category,
     c.CustomerName,
     s.UnitPrice * s.Quantity AS Sales
 FROM Sales.Fact_Sales s
 JOIN Sales.Dim_Customer c
 ON s.CustomerID = c.CustomerID
 JOIN Sales.Dim_Item i
 ON s.ItemID = i.ItemID
 WHERE YEAR(s.OrderDate) = 2021
 ),
 RankedSales AS (
     SELECT
         Category,
         CustomerName,
         SUM(Sales) AS TotalSales,
         ROW_NUMBER() OVER (PARTITION BY Category ORDER BY SUM(Sales) DESC) AS SalesRank
     FROM CategorizedSales
     WHERE Category IN ('Helmet', 'Bike', 'Gloves')
     GROUP BY Category, CustomerName
 )
 SELECT Category, CustomerName, TotalSales
 FROM RankedSales
 WHERE SalesRank = 1
 ORDER BY TotalSales DESC;
Note: The results of this query show the top customer for each of the categories: Bike, Helmet, and Gloves, based on their total sales. For example, Joan Coleman is the top customer for the Gloves category.
The category information was extracted from the
ItemNamecolumn using string manipulation, as there is no separate category column in the dimension table. This approach assumes that the item names follow a consistent naming convention. If the item names do not follow a consistent naming convention, the results may not accurately reflect the true category of each item.
In this exercise, you have created a lakehouse and a data warehouse with multiple tables. You have ingested data and used cross-database queries to load data from the lakehouse to the warehouse. Additionally, you have used the query tool to perform analytical queries.
Clean up resources
If you’ve finished exploring your data warehouse, you can delete the workspace you created for this exercise.
- In the bar on the left, select the icon for your workspace to view all of the items it contains.
- Select Workspace settings and in the General section, scroll down and select Remove this workspace.
- Select Delete to delete the workspace.