Analyze data in a data warehouse
In Microsoft Fabric, a data warehouse provides a relational database for large-scale analytics. Unlike the default read-only SQL endpoint for tables defined in a lakehouse, a data warehouse provides full SQL semantics; including the ability to insert, update, and delete data in the tables.
This lab will take approximately 30 minutes to complete.
Tip: For related training content, see Get started with data warehouses in Microsoft Fabric.
Create a workspace
Note: You need access to a Fabric paid or trial capacity to complete this exercise. For information about the free Fabric trial, see Fabric trial.
- Navigate to the Microsoft Fabric home page at
https://app.fabric.microsoft.com/home?experience=fabricin a browser, and sign in with your Fabric credentials. - In the menu bar on the left, select Workspaces (the icon looks similar to 🗇).
- Create a new workspace with a name of your choice, selecting a licensing mode that includes Fabric capacity (Trial, Premium, or Fabric).
-
When your new workspace opens, it should be empty.

Create a data warehouse
Now that you have a workspace, it’s time to create a data warehouse.
-
On the menu bar on the left, select Create. In the New page, under the Data Warehouse section, select Warehouse. Give it a unique name of your choice.
Note: If the Create option is not pinned to the sidebar, you need to select the ellipsis (…) option first.
After a minute or so, a new warehouse will be created:
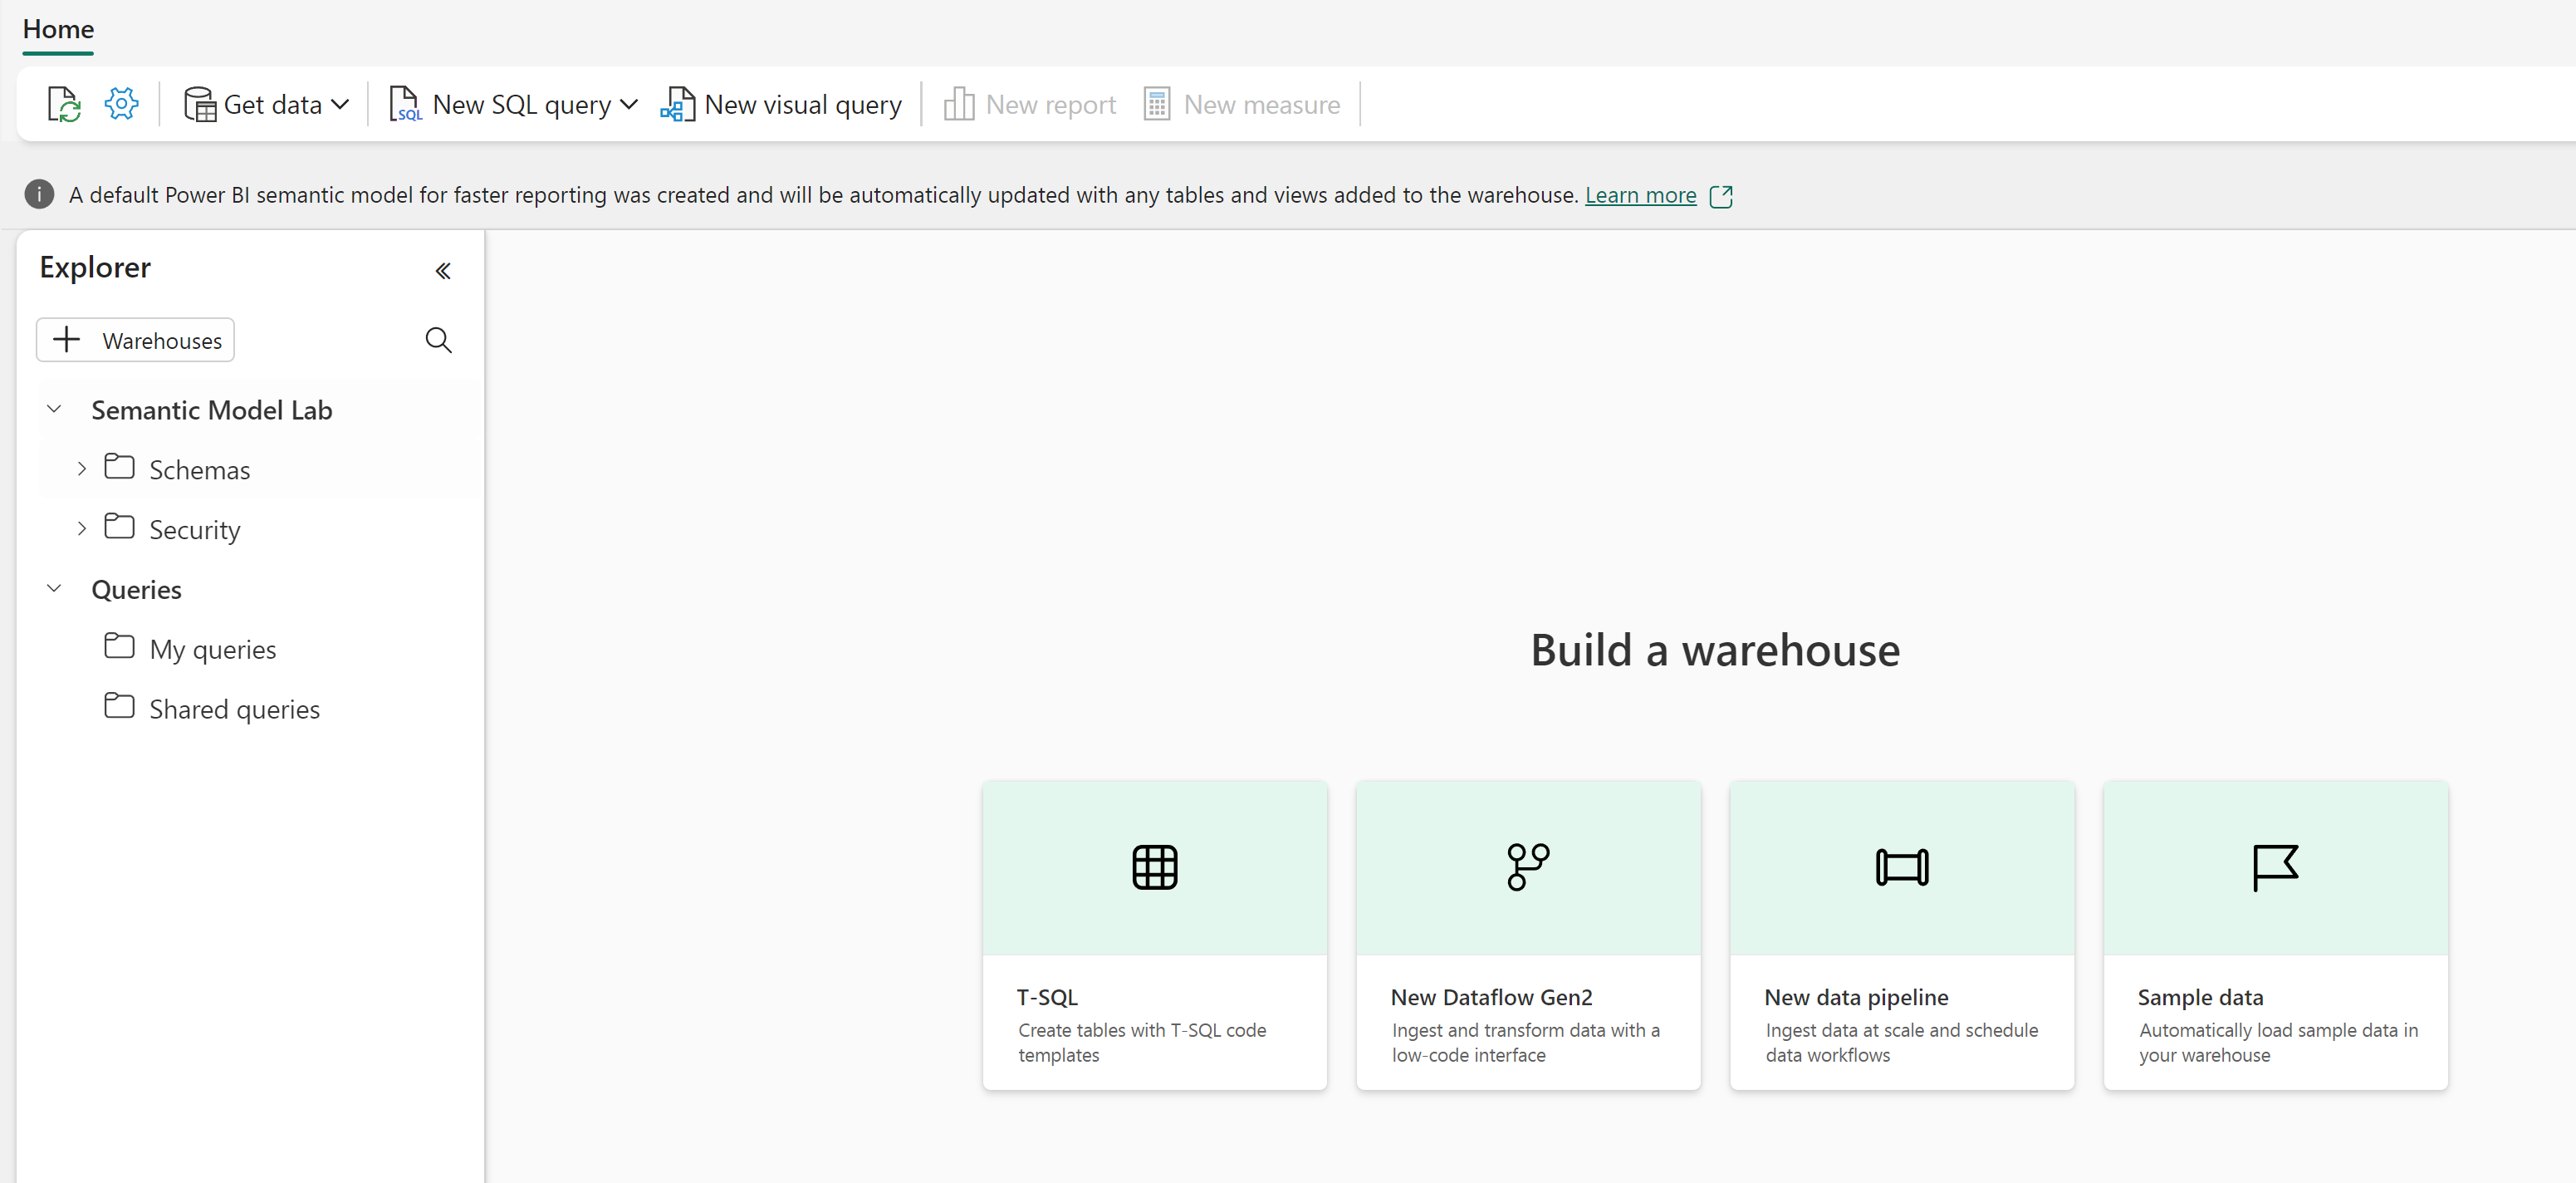
Create tables and insert data
A warehouse is a relational database in which you can define tables and other objects.
-
In your new warehouse, select the T-SQL tile, and use the following CREATE TABLE statement:
CREATE TABLE dbo.DimProduct ( ProductKey INTEGER NOT NULL, ProductAltKey VARCHAR(25) NULL, ProductName VARCHAR(50) NOT NULL, Category VARCHAR(50) NULL, ListPrice DECIMAL(5,2) NULL ); GO - Use the ▷ Run button to run the SQL script, which creates a new table named DimProduct in the dbo schema of the data warehouse.
- Use the Refresh button on the toolbar to refresh the view. Then, in the Explorer pane, expand Schemas > dbo > Tables and verify that the DimProduct table has been created.
-
On the Home menu tab, use the New SQL Query button to create a new query, and enter the following INSERT statement:
INSERT INTO dbo.DimProduct VALUES (1, 'RING1', 'Bicycle bell', 'Accessories', 5.99), (2, 'BRITE1', 'Front light', 'Accessories', 15.49), (3, 'BRITE2', 'Rear light', 'Accessories', 15.49); GO - Run the new query to insert three rows into the DimProduct table.
- When the query has finished, in the Explorer pane, select the DimProduct table and verify that the three rows have been added to the table.
- On the Home menu tab, use the New SQL Query button to create a new query. Then copy and paste the Transact-SQL code from
https://raw.githubusercontent.com/MicrosoftLearning/dp-data/main/create-dw.txtinto the new query pane. - Run the query, which creates a simple data warehouse schema and loads some data. The script should take around 30 seconds to run.
- Use the Refresh button on the toolbar to refresh the view. Then in the Explorer pane, verify that the dbo schema in the data warehouse now contains the following four tables:
- DimCustomer
- DimDate
- DimProduct
- FactSalesOrder
Tip: If the schema takes a while to load, just refresh the browser page.
Query data warehouse tables
Since the data warehouse is a relational database, you can use SQL to query its tables.
Query fact and dimension tables
Most queries in a relational data warehouse involve aggregating and grouping data (using aggregate functions and GROUP BY clauses) across related tables (using JOIN clauses).
-
Navigate back to the browser tab with your warehouse and create a new SQL Query, and run the following code:
SELECT  d.[Year] AS CalendarYear,
         d.[Month] AS MonthOfYear,
         d.MonthName AS MonthName,
        SUM(so.SalesTotal) AS SalesRevenue
FROM FactSalesOrder AS so
JOIN DimDate AS d ON so.SalesOrderDateKey = d.DateKey
GROUP BY d.[Year], d.[Month], d.MonthName
ORDER BY CalendarYear, MonthOfYear;
Note that the attributes in the date dimension enable you to aggregate the measures in the fact table at multiple hierarchical levels - in this case, year and month. This is a common pattern in data warehouses.
-
Modify the query as follows to add a second dimension to the aggregation.
SELECT d.[Year] AS CalendarYear, d.[Month] AS MonthOfYear, d.MonthName AS MonthName, c.CountryRegion AS SalesRegion, SUM(so.SalesTotal) AS SalesRevenue FROM FactSalesOrder AS so JOIN DimDate AS d ON so.SalesOrderDateKey = d.DateKey JOIN DimCustomer AS c ON so.CustomerKey = c.CustomerKey GROUP BY d.[Year], d.[Month], d.MonthName, c.CountryRegion ORDER BY CalendarYear, MonthOfYear, SalesRegion; -
Run the modified query and review the results, which now include sales revenue aggregated by year, month, and sales region.
Create a view
A data warehouse in Microsoft Fabric has many of the same capabilities you may be used to in relational databases. For example, you can create database objects like views and stored procedures to encapsulate SQL logic.
-
Modify the query you created previously as follows to create a view (note that you need to remove the ORDER BY clause to create a view).
CREATE VIEW vSalesByRegion AS SELECT d.[Year] AS CalendarYear, d.[Month] AS MonthOfYear, d.MonthName AS MonthName, c.CountryRegion AS SalesRegion, SUM(so.SalesTotal) AS SalesRevenue FROM FactSalesOrder AS so JOIN DimDate AS d ON so.SalesOrderDateKey = d.DateKey JOIN DimCustomer AS c ON so.CustomerKey = c.CustomerKey GROUP BY d.[Year], d.[Month], d.MonthName, c.CountryRegion; - Run the query to create the view. Then refresh the data warehouse schema and verify that the new view is listed in the Explorer pane.
-
Create a new SQL query and run the following SELECT statement:
SELECT CalendarYear, MonthName, SalesRegion, SalesRevenue
FROM vSalesByRegion
ORDER BY CalendarYear, MonthOfYear, SalesRegion;
Create a visual query
Instead of writing SQL code, you can use the graphical query designer to query the tables in your data warehouse. This experience is similar to Power Query online, where you can create data transformation steps with no code. For more complex tasks, you can use Power Query’s M (Mashup) language.
-
On the Home menu, expand the options under New SQL query and select New visual query.
-
Drag FactSalesOrder onto the canvas. Notice that a preview of the table is displayed in the Preview pane below.
-
Drag DimProduct onto the canvas. We now have two tables in our query.
-
Use the (+) button on the FactSalesOrder table on the canvas to Merge queries.
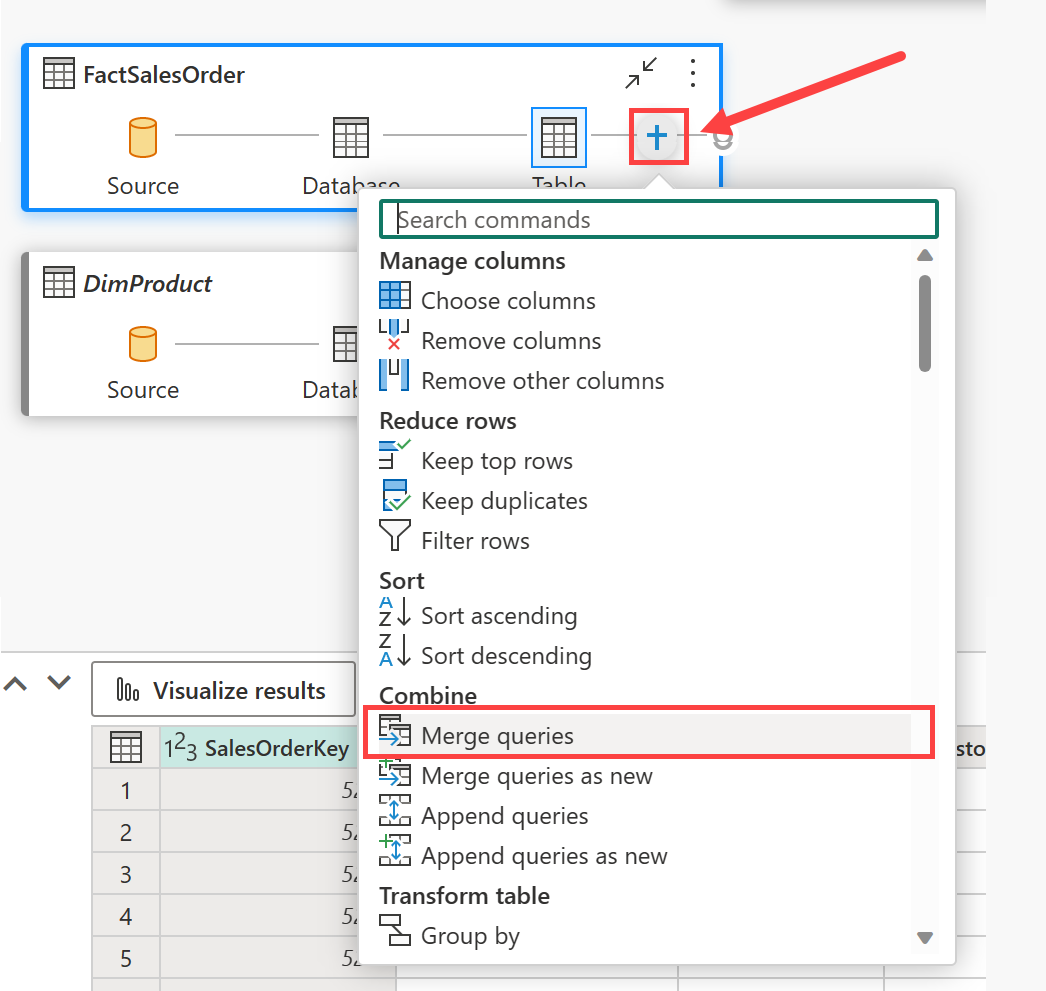
-
In the Merge queries window, select DimProduct as the right table for merge. Select ProductKey in both queries, leave the default Left outer join type, and click OK.
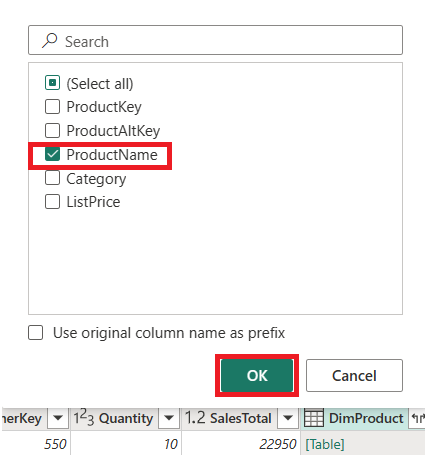
-
In the Preview, note that the new DimProduct column has been added to the FactSalesOrder table. Expand the column by clicking the arrow to the right of the column name. Select ProductName and click OK.
-
If you’re interested in looking at data for a single product, per a manager request, you can now use the ProductName column to filter the data in the query. Filter the ProductName column to look at Cable Lock data only.
-
From here, you can analyze the results of this single query by selecting Visualize results or Download Excel file. You can now see exactly what the manager was asking for, so we don’t need to analyze the results further.
(OPTIONAL) Define a data model
Note: While this task is entirely optional, you need a Power BI license or Fabric F64 SKU to create and edit semantic models.
A relational data warehouse typically consists of fact and dimension tables. The fact tables contain numeric measures you can aggregate to analyze business performance (for example, sales revenue), and the dimension tables contain attributes of the entities by which you can aggregate the data (for example, product, customer, or time). In a Microsoft Fabric data warehouse, you can use these keys to define a data model that encapsulates the relationships between the tables.
- In the toolbar, select New semantic model.
- In the New semantic model window, name the semantic model and select all four tables. Select Confirm.
-
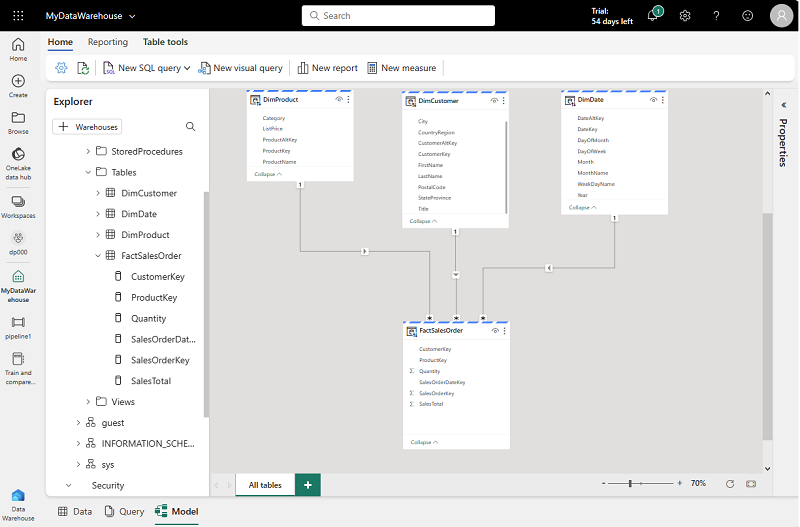
A new browser tab will automatically open with your new semantic model. In the model pane, rearrange the tables in your data warehouse so that the FactSalesOrder table is in the middle, like this:
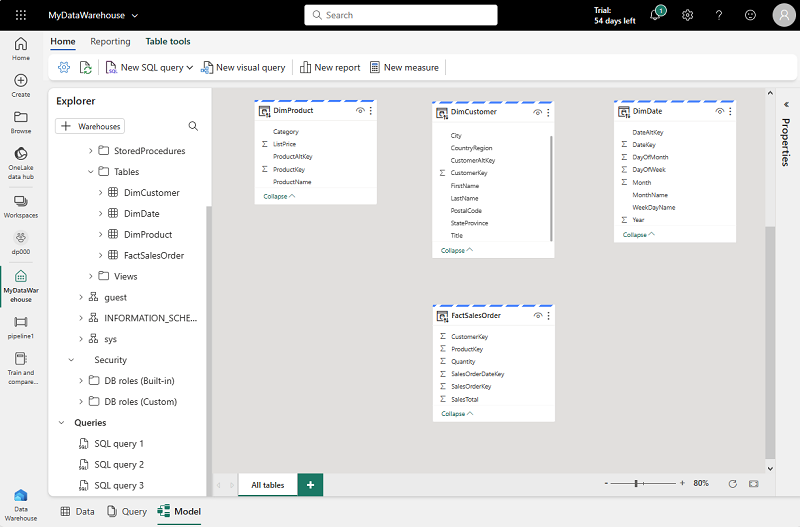
- Drag the ProductKey field from the FactSalesOrder table and drop it on the ProductKey field in the DimProduct table. Then confirm the following relationship details:
- From table: FactSalesOrder
- Column: ProductKey
- To table: DimProduct
- Column: ProductKey
- Cardinality: Many to one (*:1)
- Cross filter direction: Single
- Make this relationship active: Selected
- Assume referential integrity: Unselected
- Repeat the process to create many-to-one relationships between the following tables:
- FactSalesOrder.CustomerKey → DimCustomer.CustomerKey
- FactSalesOrder.SalesOrderDateKey → DimDate.DateKey
When all of the relationships have been defined, the model should look like this:
Clean up resources
In this exercise, you have created a data warehouse that contains multiple tables. You used SQL to insert data into the tables and queried tables using T-SQL and the visual query tool. Finally, you enhanced the data model for the data warehouse’s default dataset for downstream analytics and reporting.
If you’ve finished exploring your data warehouse, you can delete the workspace you created for this exercise.
- In the bar on the left, select the icon for your workspace to view all of the items it contains.
- In the … menu on the toolbar, select Workspace settings.
- In the General section, select Remove this workspace.