Create and use Dataflows (Gen2) in Microsoft Fabric
In Microsoft Fabric, Dataflows (Gen2) connect to various data sources and perform transformations in Power Query Online. They can then be used in Data Pipelines to ingest data into a lakehouse or other analytical store, or to define a dataset for a Power BI report.
This lab is designed to introduce the different elements of Dataflows (Gen2), and not create a complex solution that may exist in an enterprise. This lab takes approximately 30 minutes to complete.
Create a workspace
Note: You need access to a Fabric paid or trial capacity to complete this exercise. For information about the free Fabric trial, see Fabric trial.
- Navigate to the Microsoft Fabric home page at
https://app.fabric.microsoft.com/home?experience=fabricin a browser, and sign in with your Fabric credentials. - In the menu bar on the left, select Workspaces (the icon looks similar to 🗇).
- Create a new workspace with a name of your choice, selecting a licensing mode that includes Fabric capacity (Trial, Premium, or Fabric).
-
When your new workspace opens, it should be empty.

Create a lakehouse
Now that you have a workspace, it’s time to create a data lakehouse into which you’ll ingest data.
-
On the menu bar on the left, select Create. In the New page, under the Data Engineering section, select Lakehouse. Give it a unique name of your choice.
Note: If the Create option is not pinned to the sidebar, you need to select the ellipsis (…) option first.
After a minute or so, a new empty lakehouse will be created.
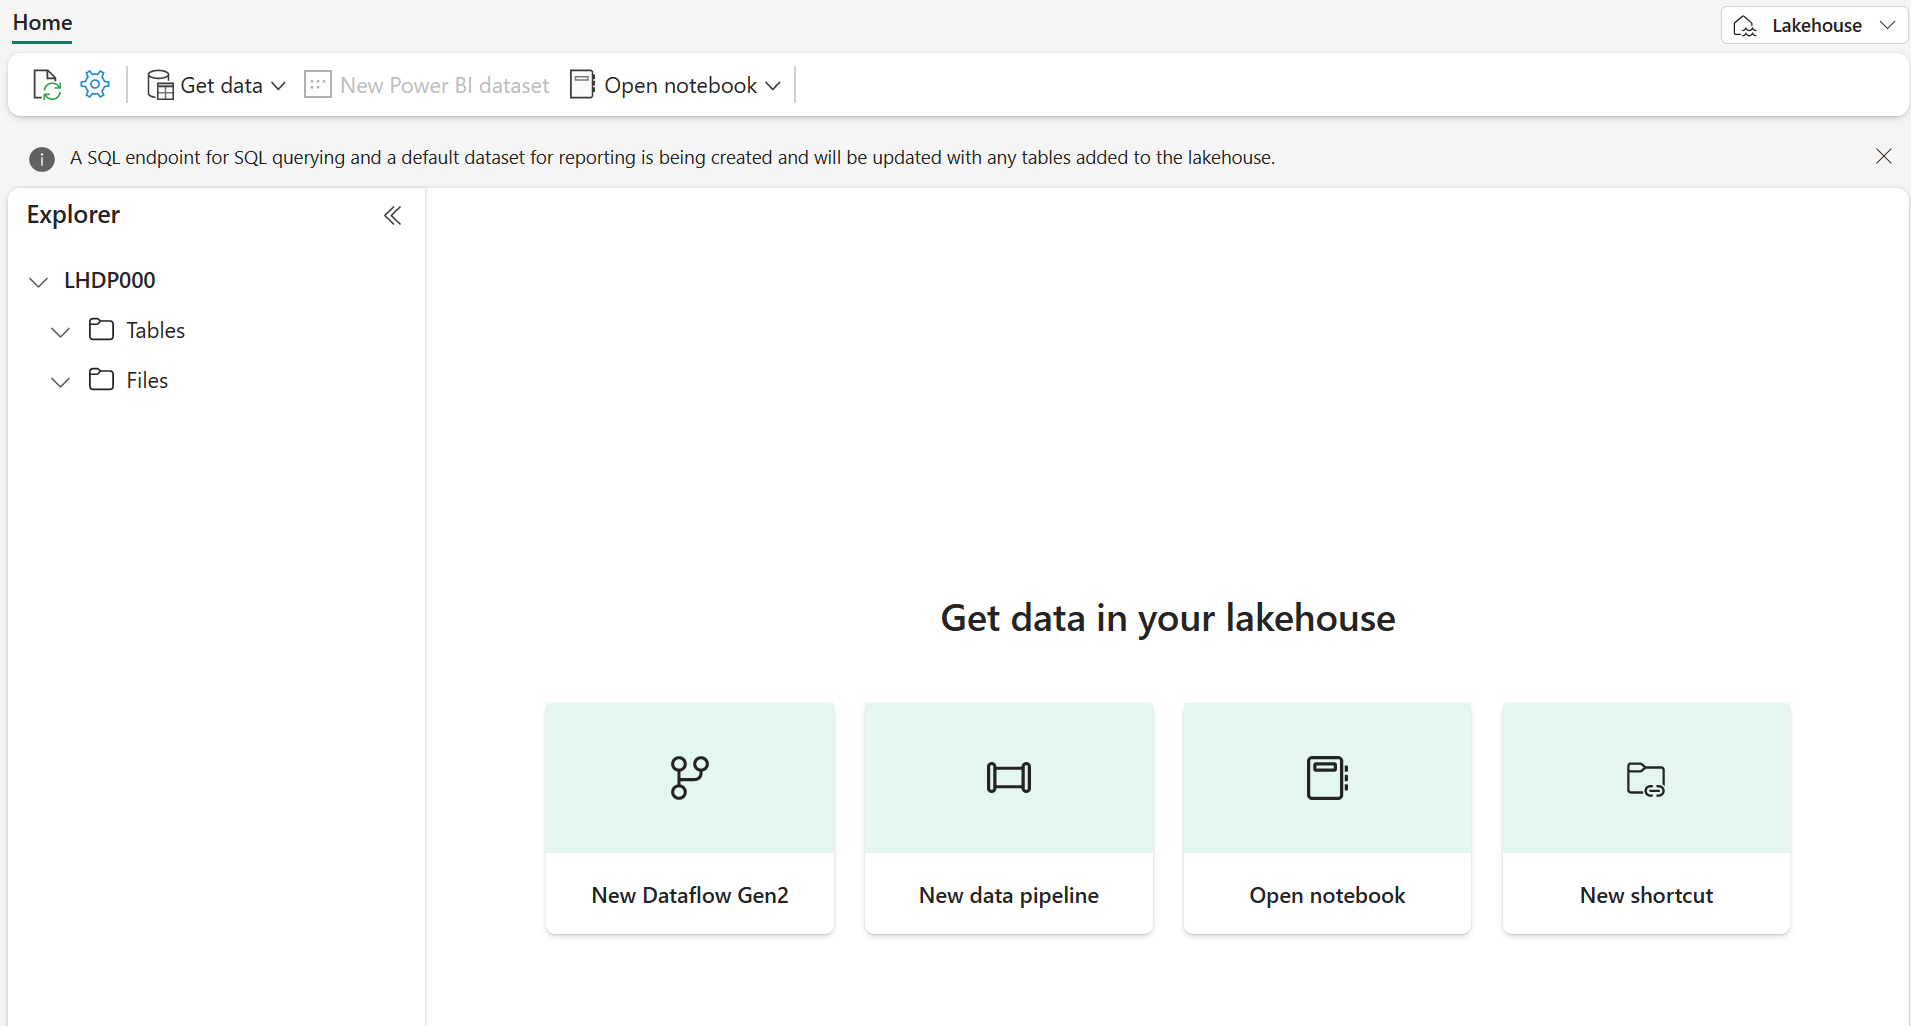
Create a Dataflow (Gen2) to ingest data
Now that you have a lakehouse, you need to ingest some data into it. One way to do this is to define a dataflow that encapsulates an extract, transform, and load (ETL) process.
- In the home page for your lakehouse, select Get data > New Dataflow Gen2. After a few seconds, the Power Query editor for your new dataflow opens as shown here.
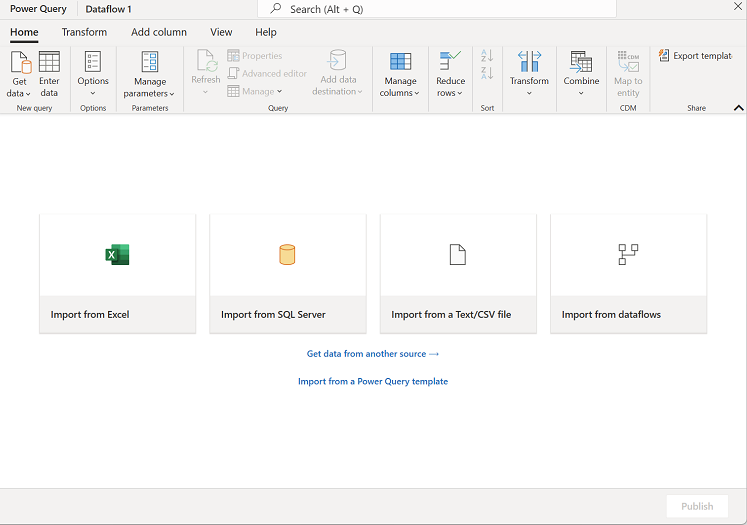
- Select Import from a Text/CSV file, and create a new data source with the following settings:
- Link to file: Selected
- File path or URL:
https://raw.githubusercontent.com/MicrosoftLearning/dp-data/main/orders.csv - Connection: Create new connection
- Connection name: Specify a unique name
- data gateway: (none)
- Authentication kind: Anonymous
- Select Next to preview the file data, and then Create the data source. The Power Query editor shows the data source and an initial set of query steps to format the data, as shown here:
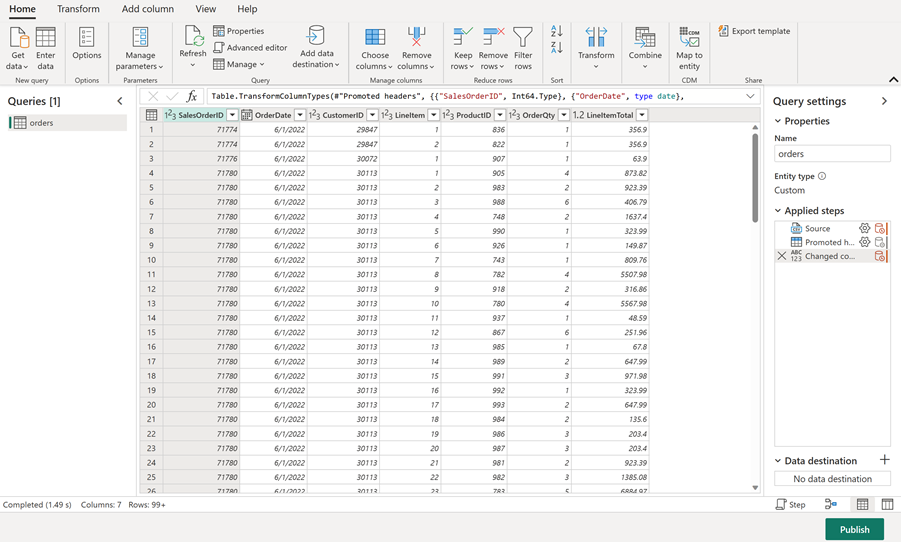
-
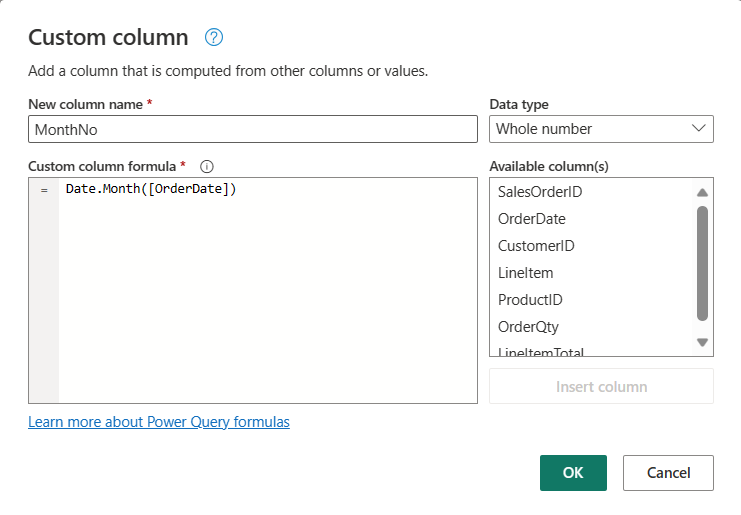
On the toolbar ribbon, select the Add column tab. Then select Custom column and create a new column.
-
Set the New column name to
MonthNo, set the Data type to Whole Number and then add the following formula:Date.Month([OrderDate])- as shown here:
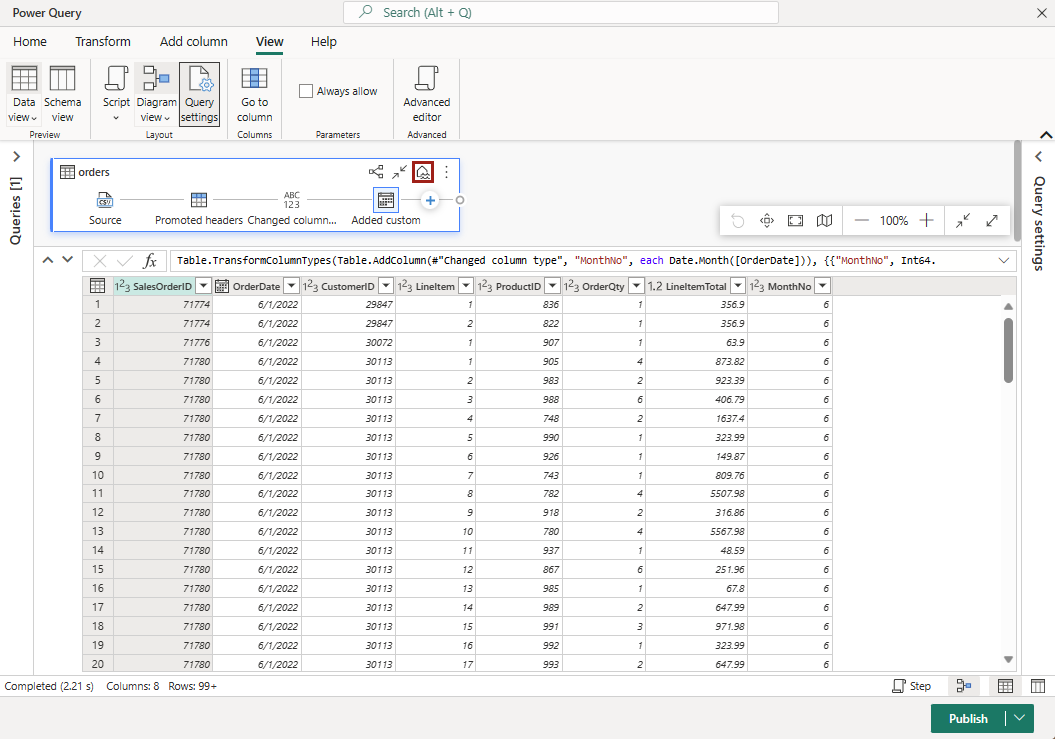
- Select OK to create the column and notice how the step to add the custom column is added to the query. The resulting column is displayed in the data pane:
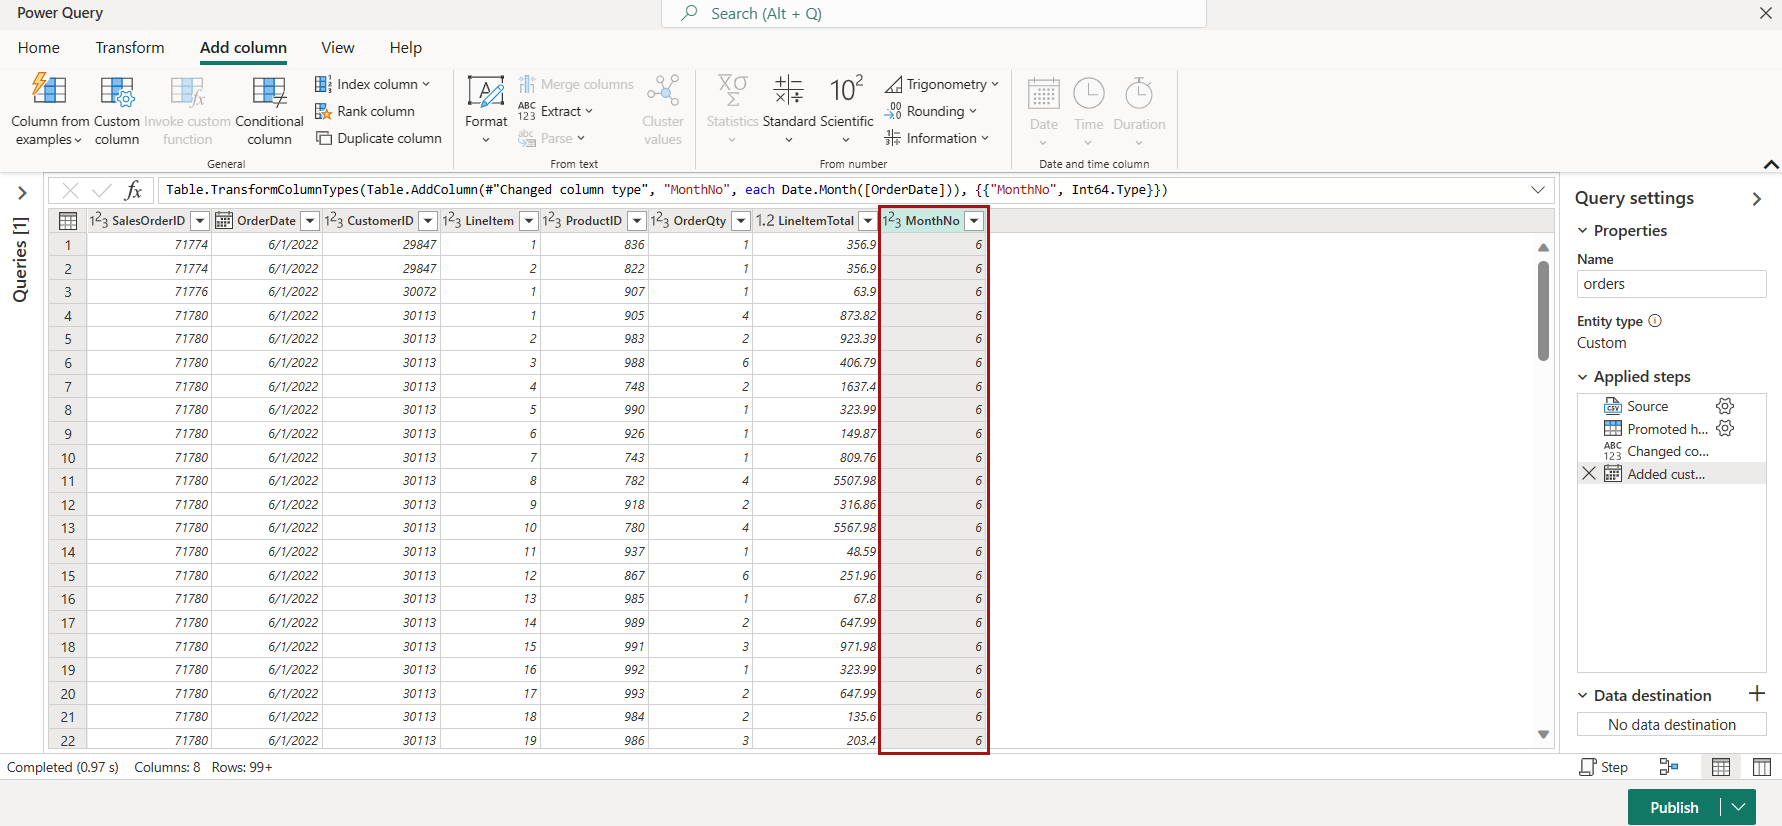
Tip: In the Query Settings pane on the right side, notice the Applied Steps include each transformation step. At the bottom, you can also toggle the Diagram flow button to turn on the Visual Diagram of the steps.
Steps can be moved up or down, edited by selecting the gear icon, and you can select each step to see the transformations apply in the preview pane.
- Check and confirm that the data type for the OrderDate column is set to Date and the data type for the newly created column MonthNo is set to Whole Number.
Add data destination for Dataflow
-
On the toolbar ribbon, select the Home tab. Then in the Query section, choose Add data destination.
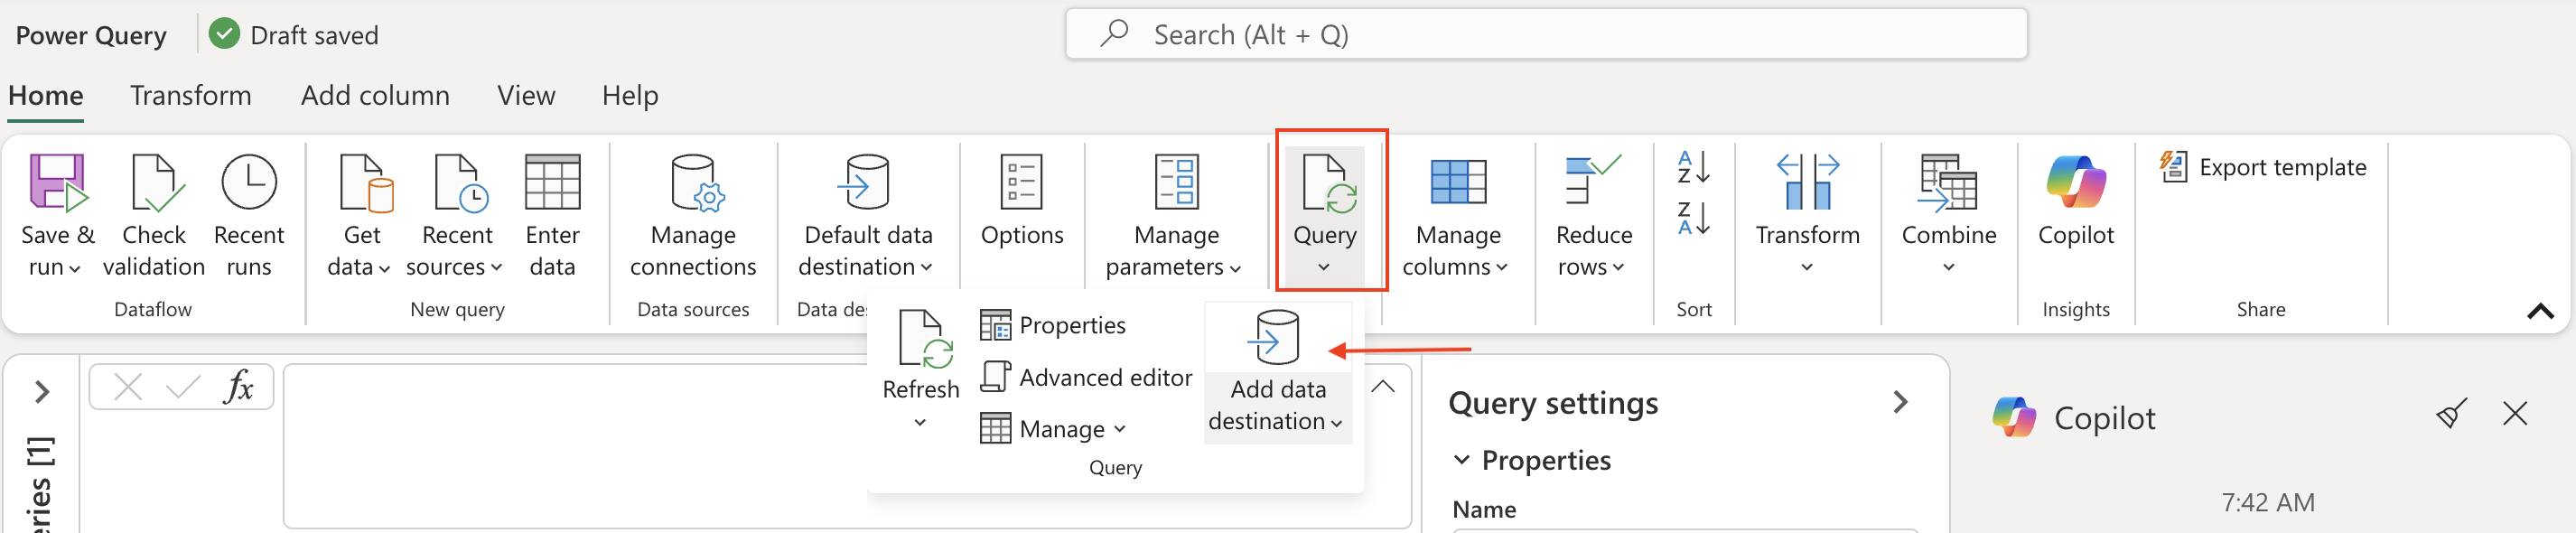
Note: If the Add data destination option is grayed out or a lakehouse destination is already shown in the query, your lakehouse has been automatically attached as the default destination because you created the dataflow from within the lakehouse. Select the existing lakehouse destination icon in the query to open the destination settings, and then continue from step 5.
-
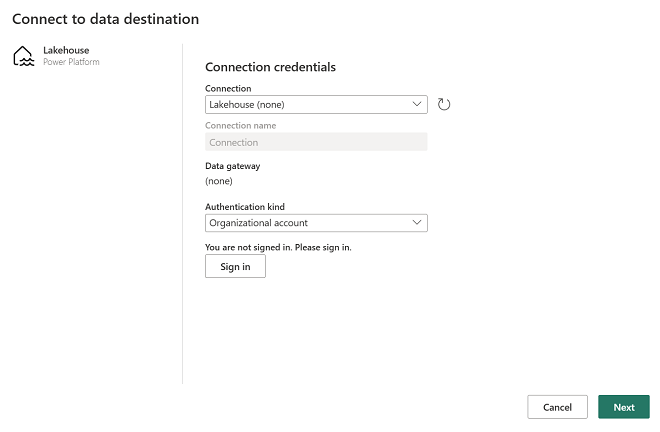
Select Lakehouse.
-
In the Connect to default data destination dialog box, edit the connection and sign in using your Power BI organizational account to set the identity that the dataflow uses to access the lakehouse.
-
Select Next and in the list of available workspaces, find your workspace and select the lakehouse you created in it at the start of this exercise. Then specify a new table named orders:
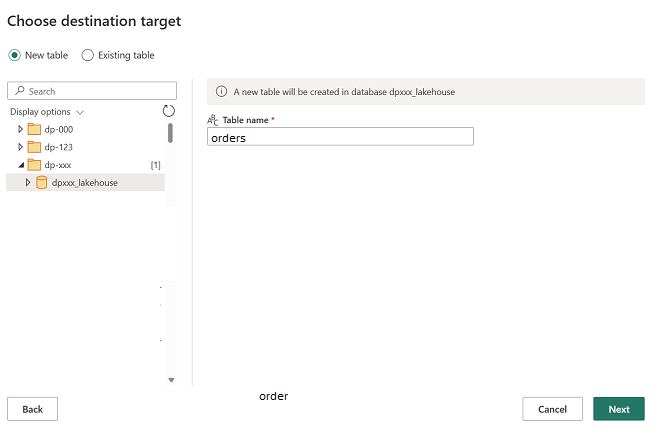
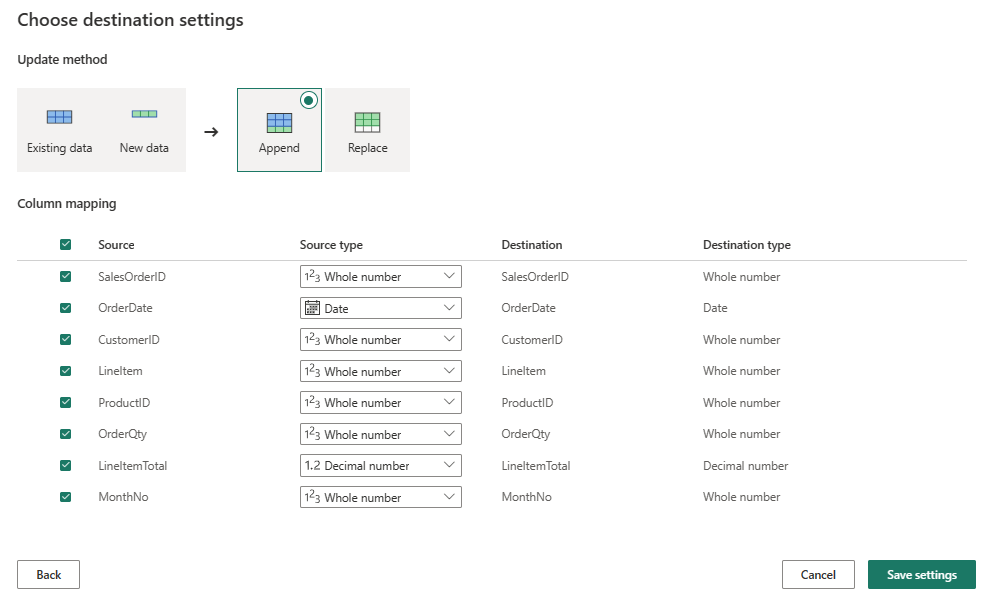
- Select Next and on the Choose destination settings page, disable the Use automatic settings option, select Append and then Save settings.
Note: We suggest using the Power query editor for updating data types, but you can also do so from this page, if you prefer.
-
On the Menu bar, open View and select Diagram view. Notice the Lakehouse destination is indicated as an icon in the query in the Power Query editor.
- On the toolbar ribbon, select the Home tab. Then select Save & run and wait for the Dataflow 1 dataflow to be created in your workspace.
Add a dataflow to a pipeline
You can include a dataflow as an activity in a pipeline. Pipelines are used to orchestrate data ingestion and processing activities, enabling you to combine dataflows with other kinds of operation in a single, scheduled process. Pipelines can be created from your workspace by selecting + New item > Data pipeline.
-
From your Fabric-enabled workspace, select + New item > Data pipeline, then when prompted, create a new pipeline named Load data.
The pipeline editor opens.
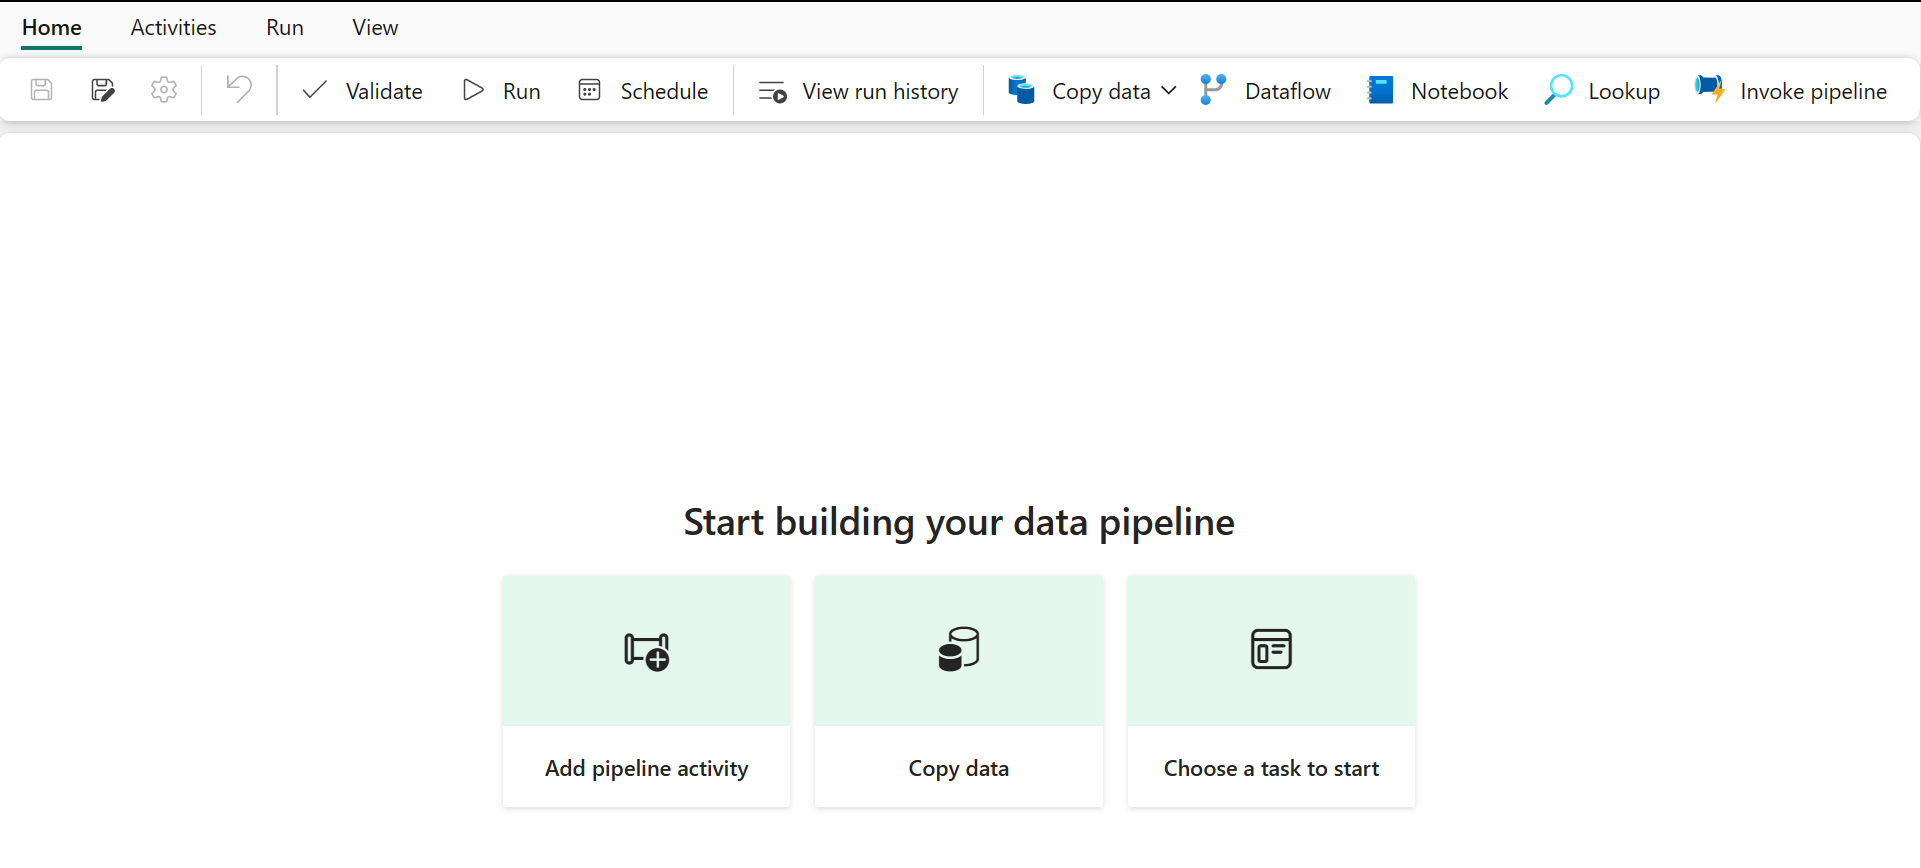
Tip: If the Copy Data wizard opens automatically, close it!
-
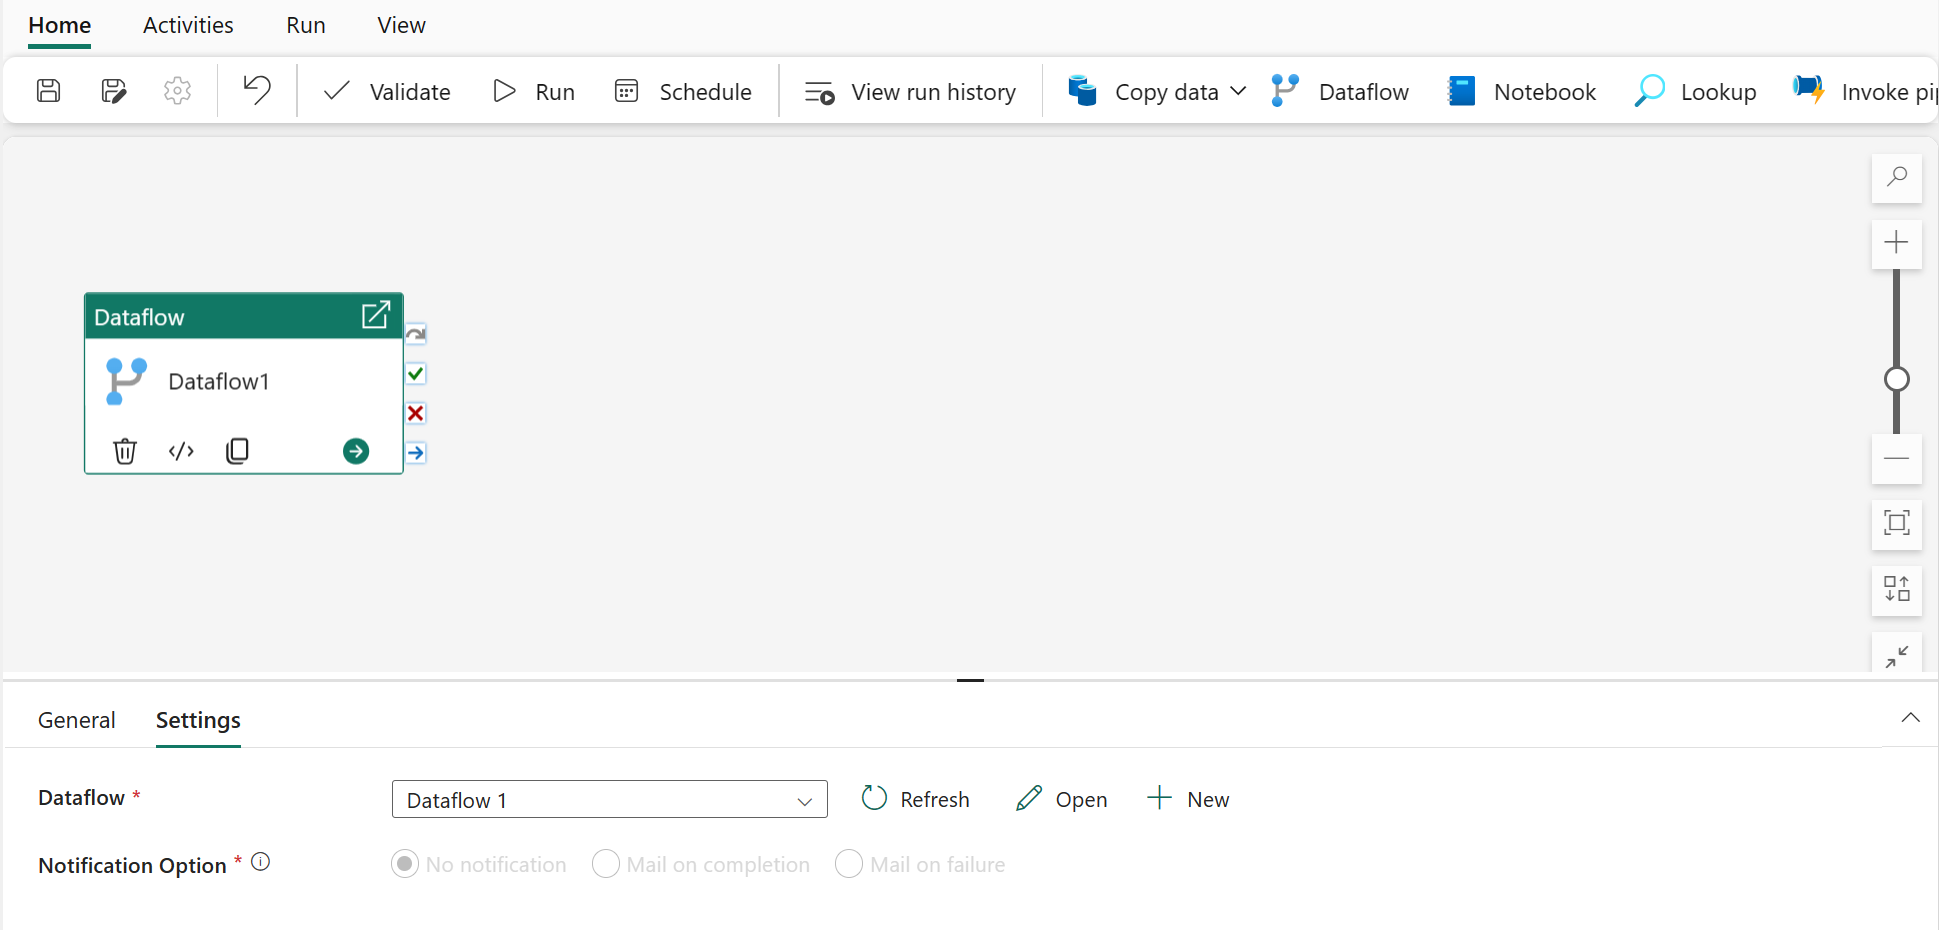
Select Pipeline activity, and add a Dataflow activity to the pipeline.
-
With the new Dataflow1 activity selected, on the Settings tab, in the Dataflow drop-down list, select Dataflow 1 (the data flow you created previously)
- On the Home tab, save the pipeline using the 🖫 (Save) icon.
-
Use the ▷ Run button to run the pipeline, and wait for it to complete. It may take a few minutes.
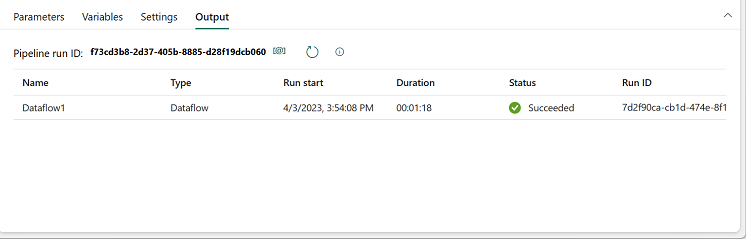
- In the menu bar on the left edge, select your lakehouse.
-
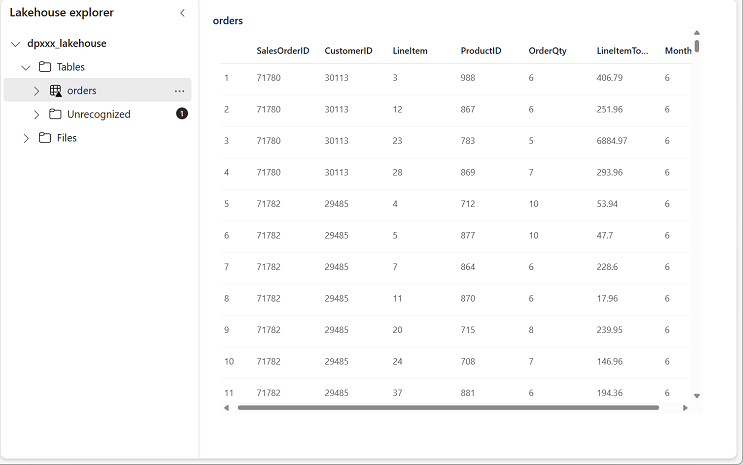
In the … menu for Tables, select refresh. Then expand Tables and select the orders table, which has been created by your dataflow.
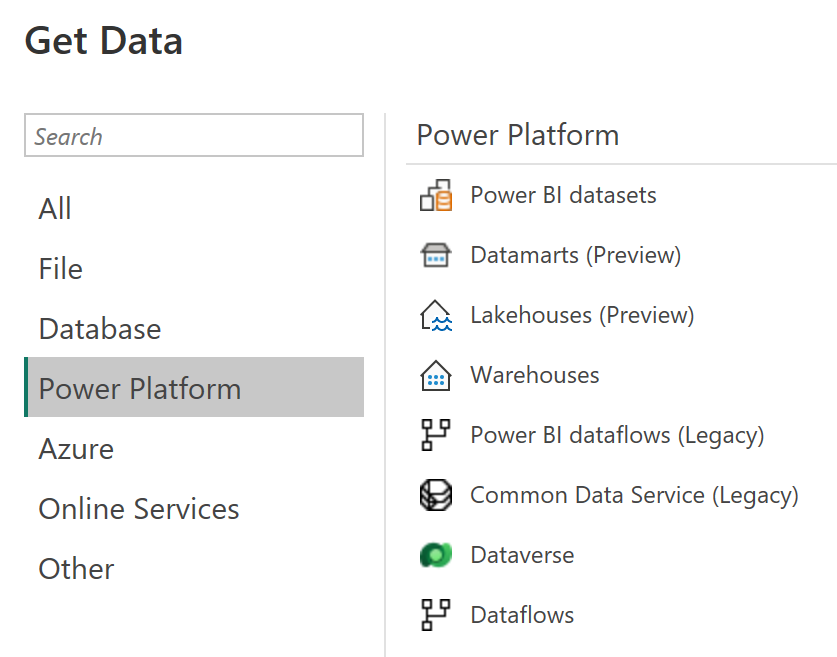
Tip: In Power BI Desktop, you can connect directly to the data transformations done with your dataflow by using the Power BI dataflows (Legacy) connector.
You can also make additional transformations, publish as a new dataset, and distribute with intended audience for specialized datasets.
Clean up resources
If you’ve finished exploring dataflows in Microsoft Fabric, you can delete the workspace you created for this exercise.
- Navigate to Microsoft Fabric in your browser.
- In the bar on the left, select the icon for your workspace to view all of the items it contains.
- Select Workspace settings and in the General section, scroll down and select Remove this workspace.
- Select Delete to delete the workspace.