Ingest data with a pipeline in Microsoft Fabric
A data lakehouse is a common analytical data store for cloud-scale analytics solutions. One of the core tasks of a data engineer is to implement and manage the ingestion of data from multiple operational data sources into the lakehouse. In Microsoft Fabric, you can implement extract, transform, and load (ETL) or extract, load, and transform (ELT) solutions for data ingestion through the creation of pipelines.
Fabric also supports Apache Spark, enabling you to write and run code to process data at scale. By combining the pipeline and Spark capabilities in Fabric, you can implement complex data ingestion logic that copies data from external sources into the OneLake storage on which the lakehouse is based, and then uses Spark code to perform custom data transformations before loading it into tables for analysis.
This lab will take approximately 45 minutes to complete.
Create a workspace
Note: You need access to a Fabric paid or trial capacity to complete this exercise. For information about the free Fabric trial, see Fabric trial.
- Navigate to the Microsoft Fabric home page at
https://app.fabric.microsoft.com/home?experience=fabric-developerin a browser and sign in with your Fabric credentials. - In the navigation pane on the left, select Workspaces (the icon looks similar to 🗇).
- Create a new workspace with a name of your choice, selecting a licensing mode in the Advanced section that includes Fabric capacity (Trial, Premium, or Fabric).
-
When your new workspace opens, it should be empty.

Create a lakehouse
Now that you have a workspace, it’s time to create a data lakehouse into which you will ingest data.
-
In the workspace, select + New item and create a new Lakehouse with a unique name of your choice. Leave the Lakehouse schemas checkbox selected.
After a minute or so, a new lakehouse with no Tables or Files will be created.
-
On the Explorer pane on the left, in the … menu for the Files node, select New subfolder and create a subfolder named new_data.
Create a pipeline
A simple way to ingest data is to use a Copy Data activity in a pipeline to extract the data from a source and copy it to a file in the lakehouse.
Note: A Copy Job and a Copy Data activity are different methods for moving data in Fabric. A Copy Job is a standalone, simplified data movement tool and doesn’t require a pipeline. A Copy Data activity is configured within a pipeline and supports orchestration with other activities. In this exercise, you use a Copy Data activity in a pipeline.
- In the navigation pane on the left, select the name of your workspace.
- In the workspace, select New item, search for Pipeline, and create a new pipeline named
Ingest Sales Data. - In the pipeline editor, on the toolbar select Copy data > Add copy data activity. A Copy Data activity is added to the pipeline canvas.
Configure the Source
- Select the Copy Data activity on the canvas, and then in the pane below the canvas select the Source tab.
- In the Connection drop-down, select Browse all. A connector selection page opens — select HTTP. A Create a connection form opens. Configure the following settings and then select Connect:
- URL:
https://raw.githubusercontent.com/MicrosoftLearning/dp-data/main/sales.csv - Connection name: Specify a unique name
- Data gateway: (none)
- Authentication kind: Anonymous
- Privacy level: None
- URL:
- Select Connect
- Back on the Source tab, configure the following source settings:
- Relative URL: Leave blank
- File format: Select DelimitedText from the drop-down
- Select the Settings button next to the File format drop-down. In the File format settings dialog, ensure the following settings are configured and then select OK:
- Compression type: No compression
- Column delimiter: Comma (,)
- Row delimiter: Line feed (\n)
- First row as header: Selected
- Select Test connection to verify the connection works.
- Optional: Select Preview data to confirm the data looks correct.
Configure the Destination
- Select the Destination tab. Then in the Connection drop-down, select Browse all.
- In the New connection dialog box, find and select your lakehouse in the OneLake Catalog section.
- After the connection is created, return to the Destination tab and configure the following settings:
- Connection: Your newly created lakehouse connection
- Lakehouse: Select the lakehouse you created earlier
- Root folder: Files
- File path: Directory: new_data / File name: sales.csv
- No other changes are necessary.
Run the pipeline
-
On the Home tab, use the 🖫 (Save) icon to save the pipeline. Then use the ▷ Run button to run the pipeline.
-
When the pipeline starts to run, you can monitor its status in the Output pane under the pipeline designer. Use the ↻ (Refresh) icon to refresh the status, and wait until it has succeeded.
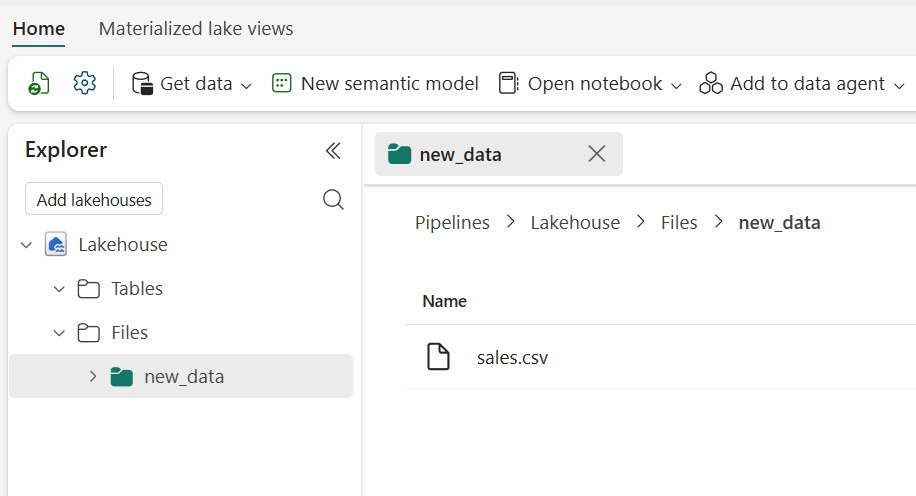
- In the navigation pane on the left, select your lakehouse.
- On the Home page, in the Explorer pane, expand Files and select the new_data folder to verify that the sales.csv file has been copied.
Create a notebook
-
Navigate to your workspace, select + New item, and search for Notebook to create a new notebook.
After a few seconds, a new notebook containing a single cell will open. Notebooks are made up of one or more cells that can contain code or markdown (formatted text).
-
In the Explorer pane on the left, select Add data items > OneLake catalog and then add your lakehouse.
-
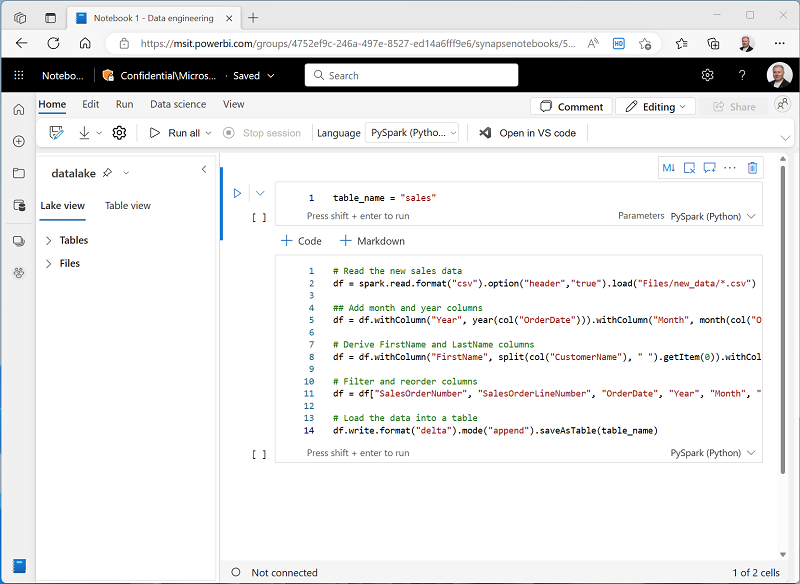
From the notebook, select the existing cell in the notebook and then replace the default code with the following variable declaration.
table_name = "dbo.sales" -
In the … menu for the cell (at its top-right) select Toggle parameter cell. This configures the cell so that the variables declared in it are treated as parameters when running the notebook from a pipeline.
-
Under the parameters cell, use the + Code button to add a new code cell. Then add the following code to it:
from pyspark.sql.functions import *

# Read the new sales data
df = spark.read.format("csv").option("header","true").load("Files/new_data/*.csv")

## Add month and year columns
df = df.withColumn("Year", year(col("OrderDate"))).withColumn("Month", month(col("OrderDate")))

# Derive FirstName and LastName columns
df = df.withColumn("FirstName", split(col("CustomerName"), " ").getItem(0)).withColumn("LastName", split(col("CustomerName"), " ").getItem(1))

# Filter and reorder columns
df = df["SalesOrderNumber", "SalesOrderLineNumber", "OrderDate", "Year", "Month", "FirstName", "LastName", "EmailAddress", "Item", "Quantity", "UnitPrice", "TaxAmount"]

# Load the data into a table
df.write.format("delta").mode("append").saveAsTable(table_name)
This code loads the data from the sales.csv file that was ingested by the Copy Data activity, applies some transformation logic, and saves the transformed data as a table - appending the data if the table already exists.
-
Verify that your notebook looks similar to this, and then use the ▷ Run all button on the toolbar to run all of the cells it contains.
Note: Since this is the first time you’ve run any Spark code in this session, the Spark pool must be started. This means that the first cell can take a minute or so to complete.
- When the notebook run has completed, in the Explorer pane on the left, in the … menu for Tables select Refresh and verify that a sales table has been created.
- In the notebook menu bar, use the Settings icon to view the notebook settings. Then set the Name of the notebook to
Load Salesand close the settings pane. - In the hub menu bar on the left, select your lakehouse.
-
In the Explorer pane, refresh the view. Then expand Tables, and select the sales table to see a preview of the data it contains.
Modify the pipeline
Now that you’ve implemented a notebook to transform data and load it into a table, you can incorporate the notebook into a pipeline to create a reusable ETL process.
- In the hub menu bar on the left select the Ingest Sales Data pipeline you created previously.
-
On the Activities tab, in the All activities list, select Delete data. Then position the new Delete data activity to the left of the Copy data activity and connect its On completion output to the Copy data activity, as shown here:
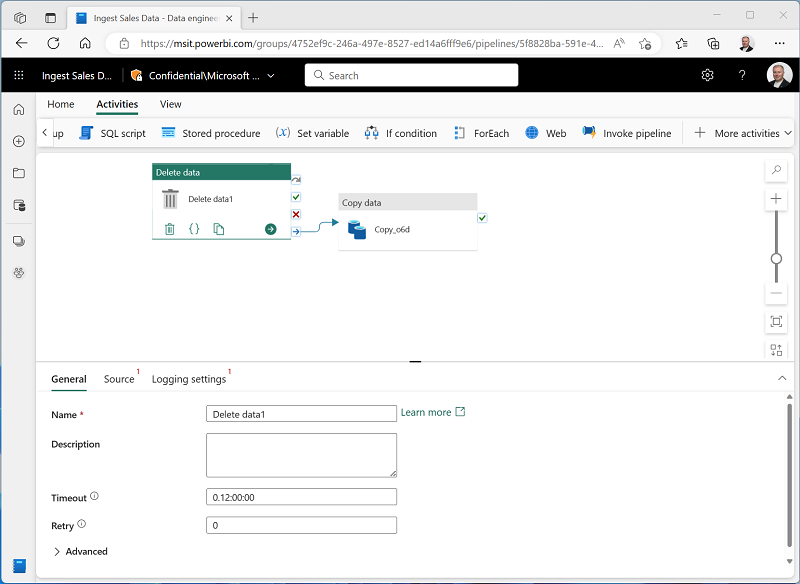
- Select the Delete data activity, and in the pane below the design canvas, set the following properties:
- General:
- Name:
Delete old files
- Name:
- Source
- Connection: Browse all, and select your lakehouse
- File path type: Wildcard file path
- Folder path: Files / new_data
- Wildcard file name:
*.csv - Recursively: Selected
- Logging settings:
- Enable logging: Unselected
These settings will ensure that any existing .csv files are deleted before copying the sales.csv file.
- General:
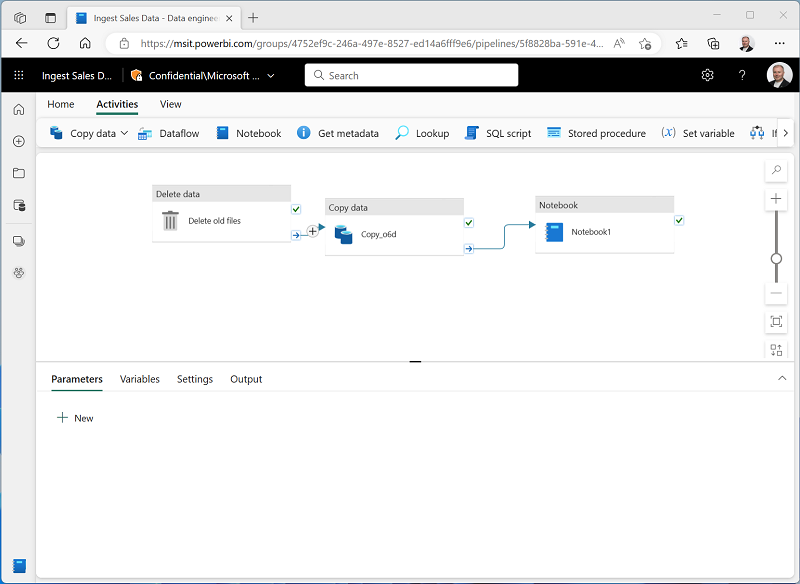
- In the pipeline designer, on the Activities tab, select Notebook to add a Notebook activity to the pipeline.
-
Select the Copy data activity and then connect its On Completion output to the Notebook activity as shown here:
- Select the Notebook activity, and then in the pane below the design canvas, set the following properties:
- General:
- Name:
Load Sales notebook
- Name:
- Settings:
- Notebook: Select your Load Sales notebook
-
Base parameters: Add a new parameter with the following properties:
Name Type Value table_name String dbo.new_sales
The table_name parameter will be passed to the notebook and override the default value assigned to the table_name variable in the parameters cell.
- General:
-
On the Home tab, use the 🖫 (Save) icon to save the pipeline. Then use the ▷ Run button to run the pipeline, and wait for all of the activities to complete.
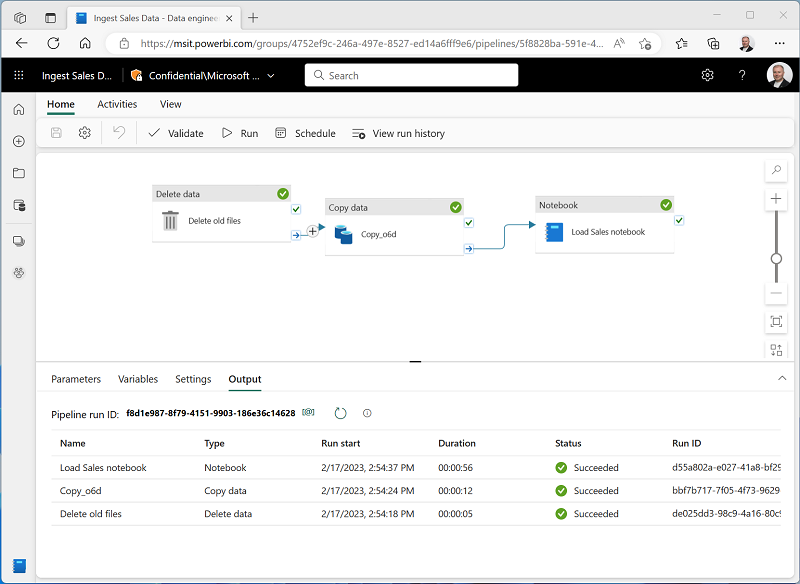
Note: In case you receive the error message Spark SQL queries are only possible in the context of a lakehouse. Please attach a lakehouse to proceed: Open your notebook, select the lakehouse you created on the left pane, select Remove all Lakehouses and then add it again. Go back to the pipeline designer and select ▷ Run.
- In the hub menu bar on the left edge of the portal, select your lakehouse.
- In the Explorer pane, expand Tables and select the new_sales table to see a preview of the data it contains. This table was created by the notebook when it was run by the pipeline.
In this exercise, you implemented a data ingestion solution that uses a pipeline to copy data to your lakehouse from an external source, and then uses a Spark notebook to transform the data and load it into a table.
Clean up resources
In this exercise, you’ve learned how to implement a pipeline in Microsoft Fabric.
If you’ve finished exploring your lakehouse, you can delete the workspace you created for this exercise.
- In the bar on the left, select the icon for your workspace to view all of the items it contains.
- Select Workspace settings and in the General section, scroll down and select Remove this workspace.
- Select Delete to delete the workspace.