Create a Lakeflow Spark Declarative Pipeline
Lakeflow Spark Declarative Pipelines is a framework within the Databricks Lakehouse Platform for building and running data pipelines in a declarative manner. This means you specify what data transformations you want to achieve, and the system automatically figures out how to execute them efficiently, handling many of the complexities of traditional data engineering.
Lakeflow Spark Declarative Pipelines simplifies the development of ETL (Extract, Transform, Load) pipelines by abstracting away the complex, low-level details. Instead of writing procedural code that dictates every step, you use a simpler, declarative syntax in SQL or Python.
This lab will take approximately 40 minutes to complete.
Note: The Azure Databricks user interface is subject to continual improvement. The user interface may have changed since the instructions in this exercise were written. Lakeflow Spark Declarative Pipelines is the evolution of Databricks’ Delta Live Tables (DLT), offering a unified approach for both batch and streaming workloads.
Provision an Azure Databricks workspace
Tip: If you already have an Azure Databricks workspace, you can skip this procedure and use your existing workspace.
This exercise includes a script to provision a new Azure Databricks workspace. The script attempts to create a Premium tier Azure Databricks workspace resource in a region in which your Azure subscription has sufficient quota for the compute cores required in this exercise; and assumes your user account has sufficient permissions in the subscription to create an Azure Databricks workspace resource. If the script fails due to insufficient quota or permissions, you can try to create an Azure Databricks workspace interactively in the Azure portal.
- In a web browser, sign into the Azure portal at
https://portal.azure.com. -
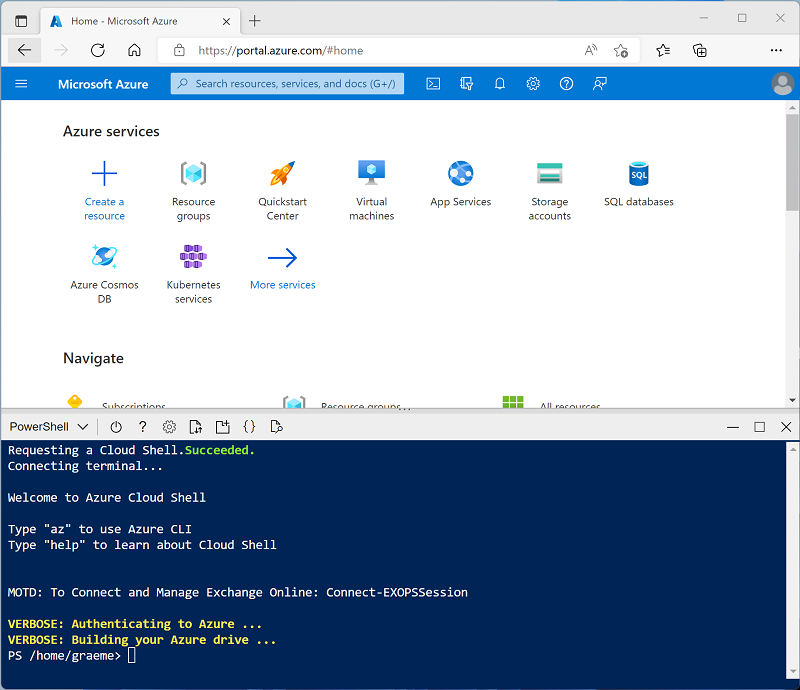
Use the [>_] button to the right of the search bar at the top of the page to create a new Cloud Shell in the Azure portal, selecting a PowerShell environment. The cloud shell provides a command line interface in a pane at the bottom of the Azure portal, as shown here:
Note: If you have previously created a cloud shell that uses a Bash environment, switch it to PowerShell.
-
Note that you can resize the cloud shell by dragging the separator bar at the top of the pane, or by using the —, ⤢, and X icons at the top right of the pane to minimize, maximize, and close the pane. For more information about using the Azure Cloud Shell, see the Azure Cloud Shell documentation.
-
In the PowerShell pane, enter the following commands to clone this repo:
rm -r mslearn-databricks -f git clone https://github.com/MicrosoftLearning/mslearn-databricks -
After the repo has been cloned, enter the following command to run the setup-serverless.ps1 script, which provisions an Azure Databricks workspace in an available region:
./mslearn-databricks/setup-serverless.ps1 -
If prompted, choose which subscription you want to use (this will only happen if you have access to multiple Azure subscriptions).
- Wait for the script to complete - this typically takes around 5 minutes, but in some cases may take longer. While you are waiting, review the Lakeflow Spark Declarative Pipelines article in the Azure Databricks documentation.
Open the Azure Databricks Workspace
-
In the Azure portal, browse to the msl-xxxxxxx resource group that was created by the script (or the resource group containing your existing Azure Databricks workspace)
-
Select your Azure Databricks Service resource (named databricks-xxxxxxx if you used the setup script to create it).
-
In the Overview page for your workspace, use the Launch Workspace button to open your Azure Databricks workspace in a new browser tab; signing in if prompted.
Tip: As you use the Databricks Workspace portal, various tips and notifications may be displayed. Dismiss these and follow the instructions provided to complete the tasks in this exercise.
Create a notebook and ingest data
-
In the sidebar, use the (+) New link to create a Notebook.
-
Change the default notebook name (Untitled Notebook [date]) to
Data Ingestion and Explorationand in the Connect drop-down list, select Serverless compute if it is not already selected. If the compute is not running, it may take a minute or so to start. -
In the first cell of the notebook, enter the following code, which creates a volume for storing covid data.
%sql CREATE VOLUME IF NOT EXISTS covid_data_volume -
Use the ▸ Run Cell menu option at the left of the cell to run it. Then wait for the Spark job run by the code to complete.
-
Create a second (Python) cell in the notebook and enter the following code.
 import requests

 # Download the CSV file
 url = "https://github.com/MicrosoftLearning/mslearn-databricks/raw/main/data/covid_data.csv"
 response = requests.get(url)
 response.raise_for_status()

 # Get the current catalog
 catalog_name = spark.sql("SELECT current_catalog()").collect()[0][0]

 # Write directly to Unity Catalog volume
 volume_path = f"/Volumes/{catalog_name}/default/covid_data_volume/covid_data.csv"
 with open(volume_path, "wb") as f:
     f.write(response.content)
This code downloads a CSV file containing COVID-19 data from a GitHub URL and saves it into a Unity Catalog volume in Databricks using the current catalog context.
-
Use the ▸ Run Cell menu option at the left of the cell to run it. Then wait for the Spark job run by the code to complete.
Create Lakeflow Declarative Pipeline using SQL
-
Select Jobs & Pipelines in the left sidebar and then select ETL pipeline.
-
Select Start with an empty file.
-
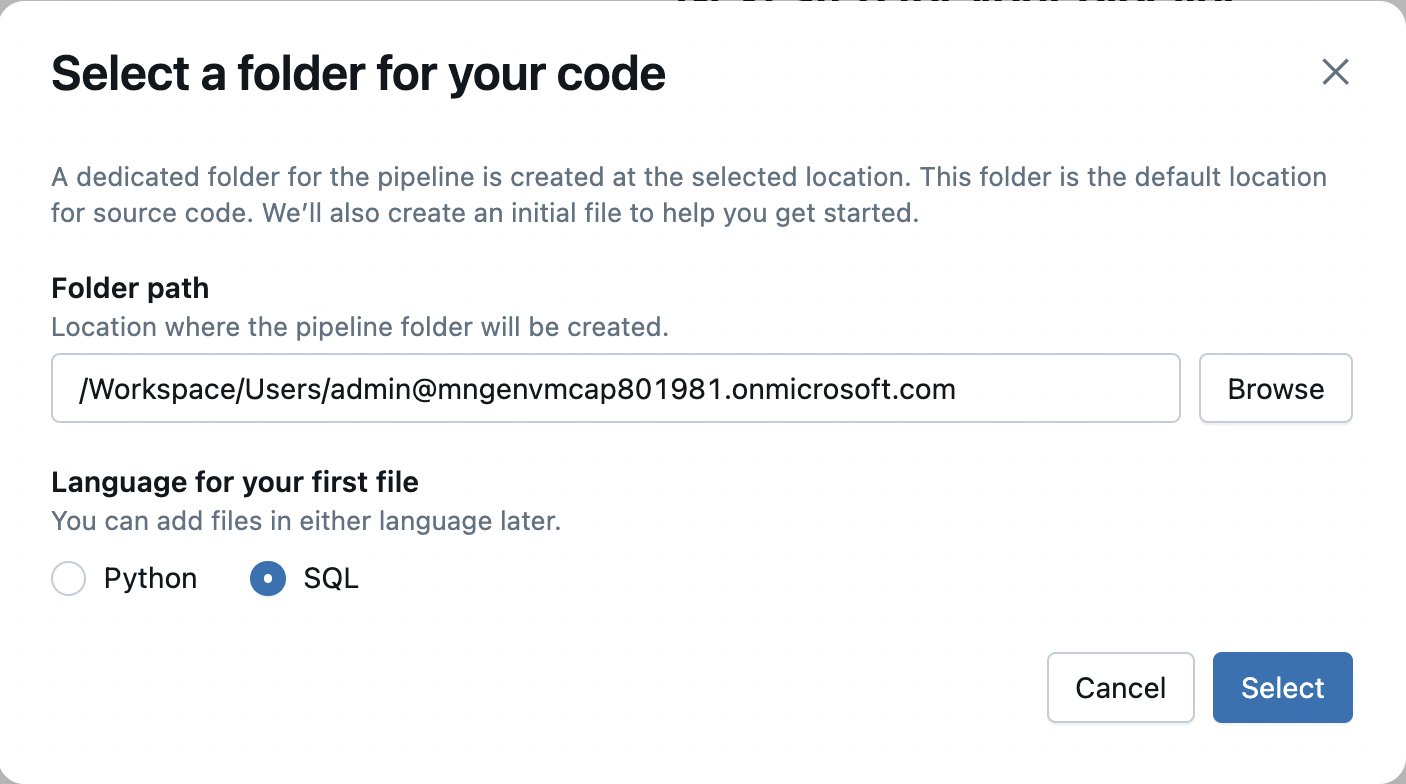
In the dialog, select SQL as the language for the first file. You do not have to update the Folder path. Go ahead and select the Select button.
-
Rename the pipeline to
Covid-Pipeline. -
Enter the following code in the editor. Make sure to replace the catalog name with your catalog name.
 CREATE OR REFRESH STREAMING TABLE covid_bronze
 COMMENT "New covid data incrementally ingested from cloud object storage landing zone";

 CREATE FLOW covid_bronze_ingest_flow AS
 INSERT INTO covid_bronze BY NAME
 SELECT
     Last_Update,
     Country_Region,
     Confirmed,
     Deaths,
     Recovered
 FROM STREAM read_files(
     -- replace with the catalog/schema you are using:
     "/Volumes/<catalog name>/default/covid_data_volume/",
     format => "csv",
     header => true
 );
This code sets up a streaming ingestion pipeline in Databricks that continuously reads new CSV files containing COVID-19 data from a Unity Catalog volume and inserts selected columns into a streaming table called covid_bronze, enabling incremental data processing and analysis.
-
Select the Run file button and observe the output. If an error shows up, make sure you have the correct catalog name defined.
-
In the same editor, enter the following code (below the previous code).
 CREATE OR REFRESH MATERIALIZED VIEW covid_silver(
 CONSTRAINT valid_country_region EXPECT (Country_Region IS NOT NULL) ON VIOLATION FAIL UPDATE
 )
 COMMENT "Formatted and filtered data for analysis."
 AS
 SELECT
     TO_DATE(Last_Update, 'MM/dd/yyyy') as Report_Date,
     Country_Region,
     Confirmed,
     Deaths,
     Recovered
 FROM covid_bronze;
This code creates or refreshes a materialized view named
covid_silverthat transforms and filters data from thecovid_bronzestreaming table by:- ✅ Converting the
Last_Updatestring into a properReport_Dateusing theMM/dd/yyyyformat. - ✅ Selecting key columns (
Country_Region,Confirmed,Deaths,Recovered) for downstream analysis. - ✅ Enforcing a data quality constraint to ensure
Country_Regionis not null—if violated during updates, the operation fails. - 📝 Adding a comment to describe the view’s purpose: formatted and filtered COVID-19 data for analysis.
This setup helps ensure clean, structured data is available for analytics or reporting.
- ✅ Converting the
-
Select the Run file button and observe the output.
-
In the same editor, enter the following code (below the previous code).
 CREATE OR REFRESH MATERIALIZED VIEW covid_gold
 COMMENT "Aggregated daily data for the US with total counts."
 AS
 SELECT
     Report_Date,
     sum(Confirmed) as Total_Confirmed,
     sum(Deaths) as Total_Deaths,
     sum(Recovered) as Total_Recovered
 FROM covid_silver
 WHERE Country_Region = 'US'
 GROUP BY Report_Date;
This SQL code creates or refreshes a materialized view named
covid_goldthat provides daily aggregated COVID-19 statistics for the U.S. by:- 🗓 Grouping data by
Report_Date - 📊 Summing up the
Confirmed,Deaths, andRecoveredcase counts across all U.S. regions for each day - 💬 Adding a comment to describe its purpose: a high-level summary of daily totals for analysis or reporting
This
covid_goldview represents the “gold layer” in a medallion architecture—optimized for consumption by dashboards, reports, or data science models. - 🗓 Grouping data by
-
Select the Run file button and observe the output.
-
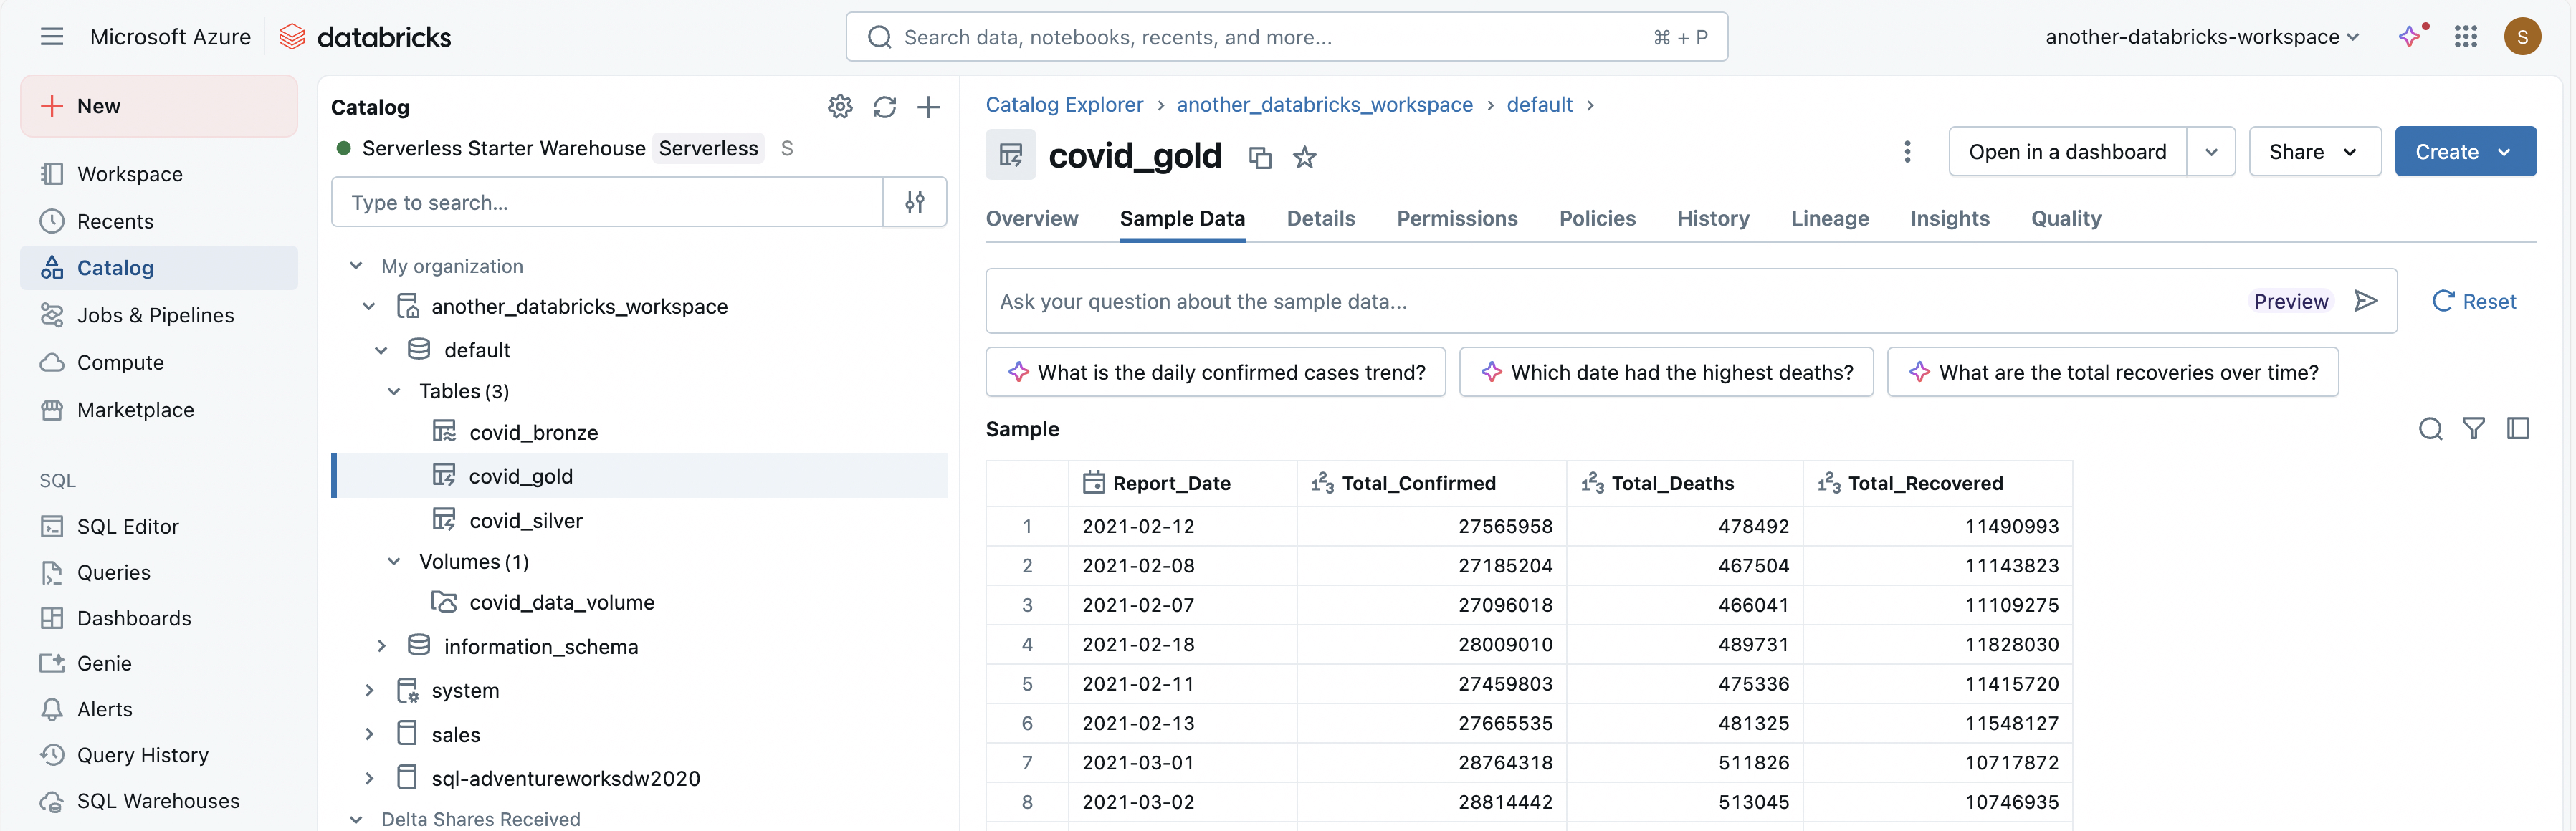
Switch back to the Catalog Explorer. Open your catalog, default schema and examine the different tables and volumes created.
View results as a visualization
After creating the tables, it is possible to load them into dataframes and visualize the data.
-
In the Data Ingestion and Exploration notebook, add a new code cell and run the following code to load the
covid_goldinto a dataframe:%sql SELECT * FROM covid_gold - Above the table of results, select + and then select Visualization to view the visualization editor, and then apply the following options:
- Visualization type: Line
- X Column: Report_Date
- Y Column: Add a new column and select Total_Confirmed. Apply the Sum aggregation.
- Save the visualization and view the resulting chart in the notebook.
Clean up
If you’ve finished exploring Azure Databricks, you can delete the resources you’ve created to avoid unnecessary Azure costs and free up capacity in your subscription.