Transform data with Apache Spark in Azure Databricks
Azure Databricks is a Microsoft Azure-based version of the popular open-source Databricks platform. Azure Databricks is built on Apache Spark, and offers a highly scalable solution for data engineering and analysis tasks that involve working with data in files.
Common data transformation tasks in Azure Databricks include data cleaning, performing aggregations, and type casting. These transformations are essential for preparing data for analysis and are part of the larger ETL (Extract, Transform, Load) process.
This exercise should take approximately 30 minutes to complete.
Note: The Azure Databricks user interface is subject to continual improvement. The user interface may have changed since the instructions in this exercise were written.
Provision an Azure Databricks workspace
Tip: If you already have an Azure Databricks workspace, you can skip this procedure and use your existing workspace.
This exercise includes a script to provision a new Azure Databricks workspace. The script attempts to create a Premium tier Azure Databricks workspace resource in a region in which your Azure subscription has sufficient quota for the compute cores required in this exercise; and assumes your user account has sufficient permissions in the subscription to create an Azure Databricks workspace resource. If the script fails due to insufficient quota or permissions, you can try to create an Azure Databricks workspace interactively in the Azure portal.
- In a web browser, sign into the Azure portal at
https://portal.azure.com. -
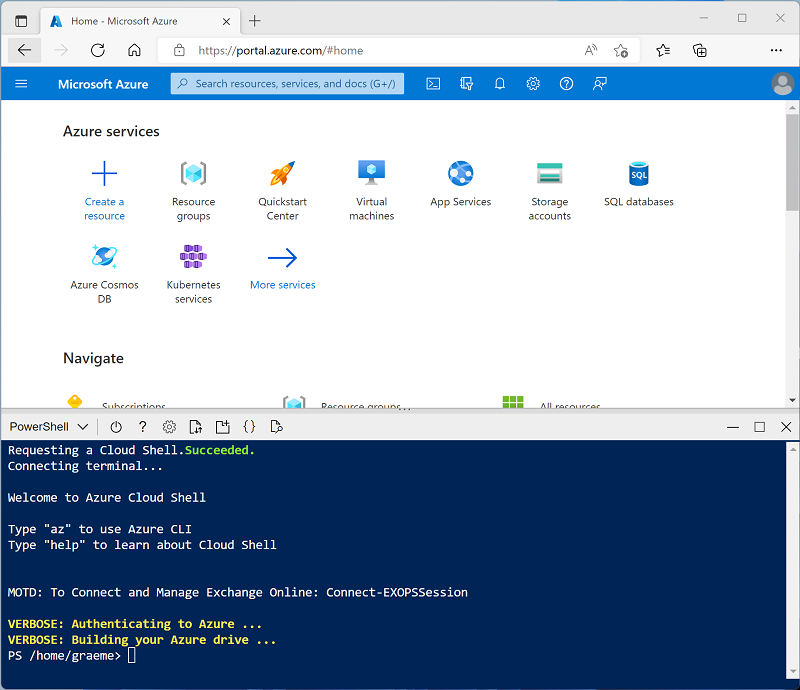
Use the [>_] button to the right of the search bar at the top of the page to create a new Cloud Shell in the Azure portal, selecting a PowerShell environment. The cloud shell provides a command line interface in a pane at the bottom of the Azure portal, as shown here:
Note: If you have previously created a cloud shell that uses a Bash environment, switch it to PowerShell.
-
Note that you can resize the cloud shell by dragging the separator bar at the top of the pane, or by using the —, ⤢, and X icons at the top right of the pane to minimize, maximize, and close the pane. For more information about using the Azure Cloud Shell, see the Azure Cloud Shell documentation.
-
In the PowerShell pane, enter the following commands to clone this repo:
rm -r mslearn-databricks -f git clone https://github.com/MicrosoftLearning/mslearn-databricks -
After the repo has been cloned, enter the following command to run the setup-serverless.ps1 script, which provisions an Azure Databricks workspace in an available region:
./mslearn-databricks/setup-serverless.ps1 - If prompted, choose which subscription you want to use (this will only happen if you have access to multiple Azure subscriptions).
- Wait for the script to complete - this typically takes around 5 minutes, but in some cases may take longer. While you are waiting, review the Exploratory data analysis on Azure Databricks article in the Azure Databricks documentation.
Open the Azure Databricks Workspace
-
In the Azure portal, browse to the msl-xxxxxxx resource group that was created by the script (or the resource group containing your existing Azure Databricks workspace)
-
Select your Azure Databricks Service resource (named databricks-xxxxxxx if you used the setup script to create it).
-
In the Overview page for your workspace, use the Launch Workspace button to open your Azure Databricks workspace in a new browser tab; signing in if prompted.
Tip: As you use the Databricks Workspace portal, various tips and notifications may be displayed. Dismiss these and follow the instructions provided to complete the tasks in this exercise.
Create a notebook
-
In the sidebar, use the (+) New link to create a Notebook.
-
Change the default notebook name (Untitled Notebook [date]) to
Transform data with Sparkand in the Connect drop-down list, select Serverless compute if it is not already selected. If the compute is not running, it may take a minute or so to start.
Ingest data
-
In the first cell of the notebook, enter the following code to create a volume for storing some lab files.
%sql CREATE VOLUME IF NOT EXISTS spark_lab -
Add a new code cell and use it to run the following code, which uses Python to download data files from GitHub into your volume.
import requests # Define the current catalog catalog_name = spark.sql("SELECT current_catalog()").collect()[0][0] # Define the base path using the current catalog volume_base = f"/Volumes/{catalog_name}/default/spark_lab" # List of files to download files = ["2019.csv", "2020.csv", "2021.csv"] # Download each file for file in files: url = f"https://raw.githubusercontent.com/MicrosoftLearning/mslearn-databricks/main/data/{file}" response = requests.get(url) response.raise_for_status() # Write to Unity Catalog volume with open(f"{volume_base}/{file}", "wb") as f: f.write(response.content) - Use the ▸ Run Cell menu option at the left of the cell to run it. Then wait for the Spark job run by the code to complete.
-
Under the output, use the + Code icon to add a new code cell, and use it to run the following code, which defines a schema for the data:
from pyspark.sql.types import *
from pyspark.sql.functions import *
orderSchema = StructType([
     StructField("SalesOrderNumber", StringType()),
     StructField("SalesOrderLineNumber", IntegerType()),
     StructField("OrderDate", DateType()),
     StructField("CustomerName", StringType()),
     StructField("Email", StringType()),
     StructField("Item", StringType()),
     StructField("Quantity", IntegerType()),
     StructField("UnitPrice", FloatType()),
     StructField("Tax", FloatType())
])
df = spark.read.load(f'/Volumes/{catalog_name}/default/spark_lab/*.csv', format='csv', schema=orderSchema)
display(df.limit(100))
Clean the data
Observe that this dataset has some duplicated rows and null values in the Tax column. Therefore, a cleaning step is required before any further processing and analysis is done with the data.
-
Add a new code cell. Then in the new cell, enter and run the following code to remove duplicate rows from the table and to replace the
nullentries with the correct values:from pyspark.sql.functions import col df = df.dropDuplicates() df = df.withColumn('Tax', col('UnitPrice') * 0.08) df = df.withColumn('Tax', col('Tax').cast("float")) display(df.limit(100))
Observe that after updating the values in the Tax column, its data type is set to float again. This is due to its data type changing to double after the calculation is performed. Since double has a higher memory usage than float, it is better for performance to type cast the column back to float.
Filter a dataframe
- Add a new code cell and use it to run the following code, which will:
- Filter the columns of the sales orders dataframe to include only the customer name and email address.
- Count the total number of order records
- Count the number of distinct customers
- Display the distinct customers
customers = df['CustomerName', 'Email']
print(customers.count())
print(customers.distinct().count())
display(customers.distinct())
Observe the following details:
- When you perform an operation on a dataframe, the result is a new dataframe (in this case, a new customers dataframe is created by selecting a specific subset of columns from the df dataframe)
- Dataframes provide functions such as count and distinct that can be used to summarize and filter the data they contain.
- The
dataframe['Field1', 'Field2', ...]syntax is a shorthand way of defining a subset of column. You can also use select method, so the first line of the code above could be written ascustomers = df.select("CustomerName", "Email")
-
Now let’s apply a filter to include only the customers who have placed an order for a specific product by running the following code in a new code cell:
customers = df.select("CustomerName", "Email").where(df['Item']=='Road-250 Red, 52')
print(customers.count())
print(customers.distinct().count())
display(customers.distinct())
Note that you can “chain” multiple functions together so that the output of one function becomes the input for the next - in this case, the dataframe created by the select method is the source dataframe for the where method that is used to apply filtering criteria.
Aggregate and group data in a dataframe
-
Run the following code in a new code cell to aggregate and group the order data:
productSales = df.select("Item", "Quantity").groupBy("Item").sum()
display(productSales)
Note that the results show the sum of order quantities grouped by product. The groupBy method groups the rows by Item, and the subsequent sum aggregate function is applied to all of the remaining numeric columns (in this case, Quantity)
-
In a new code cell, let’s try another aggregation:
yearlySales = df.select(year("OrderDate").alias("Year")).groupBy("Year").count().orderBy("Year")
display(yearlySales)
This time the results show the number of sales orders per year. Note that the select method includes a SQL year function to extract the year component of the OrderDate field, and then an alias method is used to assign a column name to the extracted year value. The data is then grouped by the derived Year column and the count of rows in each group is calculated before finally the orderBy method is used to sort the resulting dataframe.
Note: To learn more about working with Dataframes in Azure Databricks, see Introduction to DataFrames - Python in the Azure Databricks documentation.
Run SQL code in a cell
-
While it’s useful to be able to embed SQL statements into a cell containing PySpark code, data analysts often just want to work directly in SQL. Add a new code cell and use it to run the following code.
df.createOrReplaceTempView("salesorders")
This code line will create a temporary view that can then be used directly with SQL statements.
-
In a new cell, run the following code:
%sql

SELECT YEAR(OrderDate) AS OrderYear,
       SUM((UnitPrice * Quantity) + Tax) AS GrossRevenue
FROM salesorders
GROUP BY YEAR(OrderDate)
ORDER BY OrderYear;
Observe that:
- The %sql line at the beginning of the cell (called a magic) indicates that the Spark SQL language runtime should be used to run the code in this cell instead of PySpark.
- The SQL code references the salesorder view that you created previously.
- The output from the SQL query is automatically displayed as the result under the cell.
Note: For more information about Spark SQL and dataframes, see the Spark SQL documentation.
Clean up
If you’ve finished exploring Azure Databricks, you can delete the resources you’ve created to avoid unnecessary Azure costs and free up capacity in your subscription.