Explore Azure Databricks
Azure Databricks is a Microsoft Azure-based version of the popular open-source Databricks platform.
An Azure Databricks workspace provides a central point for managing Databricks clusters, data, and resources on Azure.
In this exercise, you’ll provision an Azure Databricks workspace and explore some of its core capabilities.
This exercise should take approximately 30 minutes to complete.
Note: The Azure Databricks user interface is subject to continual improvement. The user interface may have changed since the instructions in this exercise were written.
Provision an Azure Databricks workspace
Tip: If you already have an Azure Databricks workspace, you can skip this procedure and use your existing workspace.
- Sign into the Azure portal at
https://portal.azure.com. -
Use the [>_] button to the right of the search bar at the top of the page to create a new Cloud Shell in the Azure portal, selecting a PowerShell environment. The cloud shell provides a command line interface in a pane at the bottom of the Azure portal, as shown here:
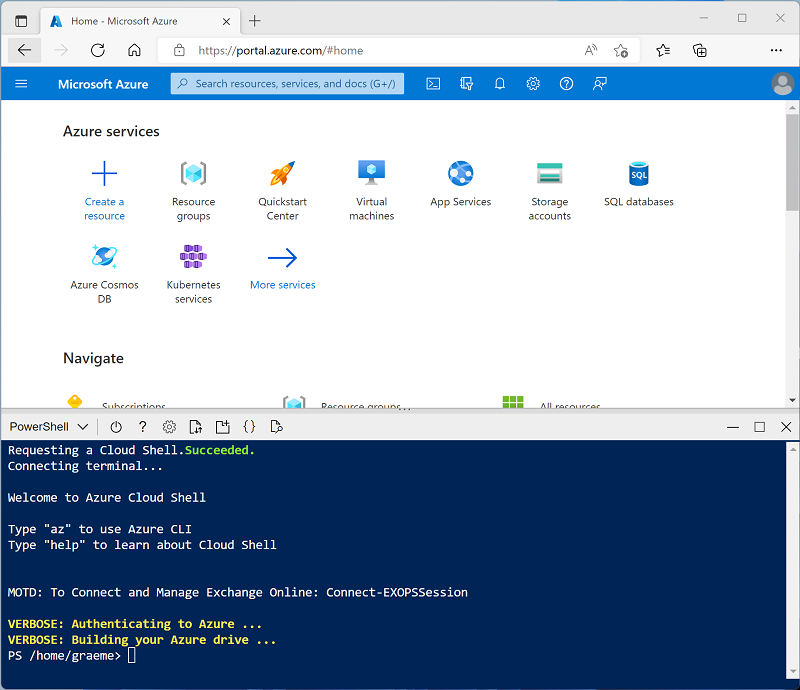
Note: If you have previously created a cloud shell that uses a Bash environment, switch it to PowerShell.
-
Note that you can resize the cloud shell by dragging the separator bar at the top of the pane, or by using the —, ⤢, and X icons at the top right of the pane to minimize, maximize, and close the pane. For more information about using the Azure Cloud Shell, see the Azure Cloud Shell documentation.
-
In the PowerShell pane, enter the following commands to clone this repo:
rm -r mslearn-databricks -f git clone https://github.com/MicrosoftLearning/mslearn-databricks -
After the repo has been cloned, enter the following command to run the setup-serverless.ps1 script, which provisions an Azure Databricks workspace in an available region:
./mslearn-databricks/setup-serverless.ps1 - If prompted, choose which subscription you want to use (this will only happen if you have access to multiple Azure subscriptions).
- Wait for the script to complete - this typically takes around 5 minutes, but in some cases may take longer. While you are waiting, review the Exploratory data analysis on Azure Databricks article in the Azure Databricks documentation.
Open the Azure Databricks Workspace
-
In the Azure portal, browse to the msl-xxxxxxx resource group that was created by the script (or the resource group containing your existing Azure Databricks workspace)
-
Select your Azure Databricks Service resource (named databricks-xxxxxxx if you used the setup script to create it).
-
In the Overview page for your workspace, use the Launch Workspace button to open your Azure Databricks workspace in a new browser tab; signing in if prompted.
Tip: As you use the Databricks Workspace portal, various tips and notifications may be displayed. Dismiss these and follow the instructions provided to complete the tasks in this exercise.
Use Spark to analyze data
As in many Spark environments, Databricks supports the use of notebooks to combine notes and interactive code cells that you can use to explore data.
- Download the products.csv file from
https://raw.githubusercontent.com/MicrosoftLearning/mslearn-databricks/main/data/products.csvto your local computer, saving it as products.csv. - In the sidebar, in the (+) New link menu, select Add or upload data.
- Select Create or modify table and upload the products.csv file you downloaded to your computer.
- In the Create or modify table from file upload page, ensure that your Serverless Starter Warehouse is selected at the top right of the page. Then choose your catalog and its default schema to create a new table named products.
- In the Catalog Explorer page when the products table has been created, in the Create button menu, select Notebook to create a notebook.
-
In the notebook, ensure that the notebook is connected to the Serverless compute and then review the code that has been automatically been added to the first cell; which should look similar to this:
%sql SELECT * FROM `<your catalog>`.`default`.`products`; - Use the ▸ Run Cell menu option at the left of the cell to run it, starting and attaching the cluster if prompted.
- Wait for the Spark job run by the code to complete. The code retrieves data from the table that was created based on the file you uploaded.
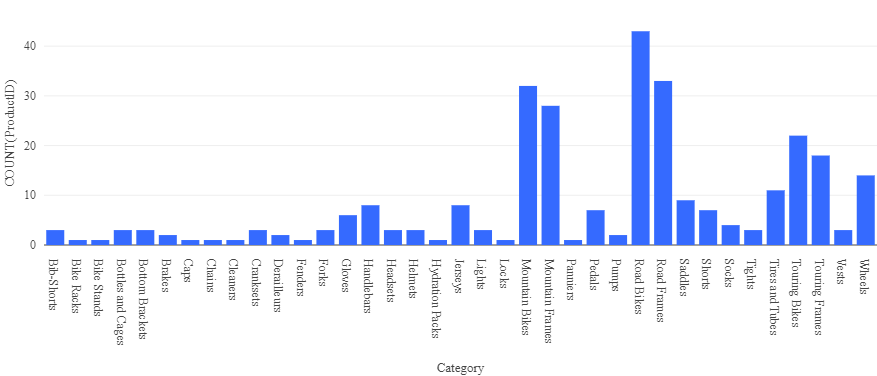
- Above the table of results, select + and then select Visualization to view the visualization editor, and then apply the following options:
- Visualization type: Bar
- X Column: Category
- Y Column: Add a new column and select ProductID. Apply the Count aggregation.
Save the visualization and observe that it is displayed in the notebook, like this:
Analyze data with a dataframe
While most data analysts are comfortable using SQL code as used in the previous example, some data analysts and data scientists can use native Spark objects such as a dataframe in programming languages such as PySpark (A Spark-optimized version of Python) to work efficiently with data.
-
In the notebook, under the chart output from the previously run code cell, use the + Code icon to add a new cell.
Tip: You may need to move the mouse under the output cell to make the + Code icon appear.
-
Enter and run the following code in the new cell:
df = spark.sql("SELECT * FROM products") df = df.filter("Category == 'Road Bikes'") display(df) -
Run the new cell, which returns products in the Road Bikes category.
Use Databricks Assistant
Databricks Assistant is an AI-powered tool that helps you write, understand, and debug code. It is available within notebooks and provides natural language assistance.
-
In the notebook, select the Assistant icon (which looks like a chat bubble) in the upper-right area of the notebook to open the Assistant panel.
Note: You may be asked to accept the terms and conditions before using the Databricks Assistant.
-
In the Assistant panel, type the question
What is a Spark dataframe?and submit it. The Assistant will provide a response explaining what dataframes are and how they are used in Spark. -
Try asking the Assistant a data-related question. Type
Show me only products with a price over 100and submit it. The Assistant will generate SQL or Python code to filter the data based on your request. -
Create a new cell and insert the code it generated. Run the cell and observe the output.
[!NOTE] If and error message appears, try selecting the Diagnose error button.
-
To see how the Assistant can help fix code, add a new code cell with the following code that contains a deliberate error:
df = spark.sql("SELECT * FORM products") display(df) -
Run the cell and observe the error message. Then, select the Diagnose error button that appears or ask the Assistant
Fix this codeand include the code. The Assistant will identify the problem (the keywordFORMshould beFROM) and suggest the corrected code.df = spark.sql("SELECT * FROM products") display(df) -
Apply the fix and run the cell to verify it now works correctly.
Clean up
In Azure Databricks portal, on the Compute page, select your cluster and select ■ Terminate to shut it down.
If you’ve finished exploring Azure Databricks, you can delete the resources you’ve created to avoid unnecessary Azure costs and free up capacity in your subscription.