Monitor an application with autoinstrumentation
In this exercise, you create an Azure App Service web app with Application Insights enabled, configure autoinstrumentation without modifying code, create and deploy a Blazor application, and then view application metrics and error data in Application Insights. Implementing comprehensive application monitoring and observability, without having to make changes to your code, makes deployments and migrations simpler.
Tasks performed in this exercise:
- Create a web app resource with Application Insights enabled
- Configure instrumentation for the web app.
- Create a new Blazor app and deploy it to the web app resource.
- View application activity in Application Insights
- Clean up resources
This exercise takes approximately 20 minutes to complete.
Create resources in Azure
-
In your browser navigate to the Azure portal https://portal.azure.com; signing in with your Azure credentials if prompted.
-
Select the + Create a resource located in the Azure Services heading near the top of the homepage.
-
In the Search the Marketplace search bar, enter web app and press enter to start searching.
-
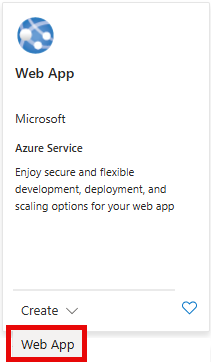
In the Web App tile, select the Create drop-down and then select Web App.
Selecting Create will open a template with a few tabs to fill out with information about your deployment. The following steps walk you through what changes to make in the relevant tabs.
-
Fill out the Basics tab with the information in the following table:
Setting Action Subscription Retain the default value. Resource group Select Create new, enter rg-WebApp, and then select OK. You can also select an existing resource group if you prefer.Name Enter a unique name, for example YOUR-INITIALS-monitorapp. Replace YOUR-INITIALS with your initials, or some other value. The name needs to be unique, so it may require a few changes. Slider under Name setting Select the slider to turn it off. This slider only appears in some Azure configurations. Publish Select the Code option. Runtime stack Select .NET 8 (LTS) in the drop-down menu. Operating System Select Windows. Region Retain the default selection, or choose a region near you. Windows Plan Retain the default selection. Pricing plan Select the drop-down and choose the Free F1 plan. -
Select, or navigate to, the Monitor + secure tab, and enter the information in the following table:
Setting Action Enable Application Insights Select Yes. Application Insights Select Create new and a dialog box will appear. Enter autoinstrument-insightsin the Name field of the dialog box. Then select OK to accept the name.Workspace Enter Workspaceif the field isn't already filled in and locked. -
Select Review + create and review the details of your deployment. Then select Create to create the resources.
It will take a few minutes for the deployment to complete. When it's finished, select the Go to resource button.
Configure instrumentation settings
To enable monitoring without changes to your code, you need to configure the instrumentation for your app at the service level.
-
In the left-navigation menu expand Monitoring and select Application Insights.
-
Locate the Instrument your application section and select .NET Core.
-
Select Recommended in the Collection level section.
-
Select Apply and then confirm the changes.
-
In the left-navigation menu, select Overview.
Create and deploy a Blazor app
In this section of the exercise you create a Blazor app in the Cloud Shell and deploy it to the web app you created. All of the steps in this section are performed in the Cloud Shell.
-
Use the [>_] button to the right of the search bar at the top of the page to create a new cloud shell in the Azure portal, selecting a Bash environment. The cloud shell provides a command line interface in a pane at the bottom of the Azure portal. If you are prompted to select a storage account to persist your files, select No storage account required, your subscription, and then select Apply.
Note: If you have previously created a cloud shell that uses a PowerShell environment, switch it to Bash.
-
Run the following commands to create a directory for the Blazor app and change into the directory.
mkdir blazor cd blazor -
Run the following command to create a new Blazor app in the folder.
dotnet new blazor -
Run the following command to build the application to ensure there were no issues during creation.
dotnet build
Deploy the app to App Service
To deploy the app you first need to publish it with the dotnet publish command, and then create a .zip file for deployment.
-
Run the following command to publish the app into a publish directory.
dotnet publish -c Release -o ./publish -
Run the following commands to create a .zip file of the published app. The .zip file will be located in the root directory of the application.
cd publish zip -r ../app.zip . cd .. -
Run the following command to deploy the app to App Service. Replace YOUR-WEB-APP-NAME AND YOUR-RESOURCE-GROUP with the values you used when creating the App Service resources earlier in the exercise.
az webapp deploy --name YOUR-WEB-APP-NAME \
    --resource-group YOUR-RESOURCE-GROUP \
    --src-path ./app.zip
Note: You might need to run az login, or az login --use-device-code in the cloud shell for the az webapp up command to work.
-
When the deployment is completed, select the link in the Default domain field located in the Essentials section to open the app in a new tab in your browser.
Now it's time to view some basic application metrics in Application Insights. Don't close this tab, you'll use it in the rest of the exercise.
View metrics in Application Insights
Return the tab with the Azure Portal and navigate to the Application Insights resource you created earlier. The Overview tab displays some basic charts:
- Failed requests
- Server response time
- Server requests
- Availability
In this section you will perform some actions in the web app and then return to this page to view the activity. The activity reporting is delayed, so it may take a few minutes for it to appear in the charts.
Perform the following steps in the web app.
-
Navigate between the Home, + Counter, and Weather navigation options in the menu of the web app.
-
Refresh the web page several times to generate Server response time and Server requests data.
-
To create some errors, select the Home button and then append the URL with /failures. This route doesn't exist in the web app and will generate an error. Refresh the page several times to generate error data.
-
Return to the tab where Application Insights is running, and wait a minute or two for the information to appear in the charts.
-
In the left-navigation expand the Investigate section and select Failures. It displays the failed request count along with more detailed information about the response codes for the failures.
Explore other reporting options to get an idea of what other types of information is available.
Clean up resources
Now that you finished the exercise, you should delete the cloud resources you created to avoid unnecessary resource usage.
- In your browser navigate to the Azure portal https://portal.azure.com; signing in with your Azure credentials if prompted.
- Navigate to the resource group you created and view the contents of the resources used in this exercise.
- On the toolbar, select Delete resource group.
- Enter the resource group name and confirm that you want to delete it.
CAUTION: Deleting a resource group deletes all resources contained within it. If you chose an existing resource group for this exercise, any existing resources outside the scope of this exercise will also be deleted.