Learning Path 8 - Lab 1 - Exercise 1 - Perform Threat Hunting in Microsoft Sentinel
Lab scenario
You are a Security Operations Analyst working at a company that implemented Microsoft Sentinel. You have received threat intelligence about a Command and Control (C2 or C&C) technique. You need to perform a hunt and watch for the threat.
Important: The log data used in the lab was created in the previous module. See Attack 3 on WIN1 server in Exercise 5.
Note: Because you already experienced the process of exploring data in a previous module, this lab provides a KQL statement to start with.
Note: An interactive lab simulation is available that allows you to click through this lab at your own pace. You may find slight differences between the interactive simulation and the hosted lab, but the core concepts and ideas being demonstrated are the same.
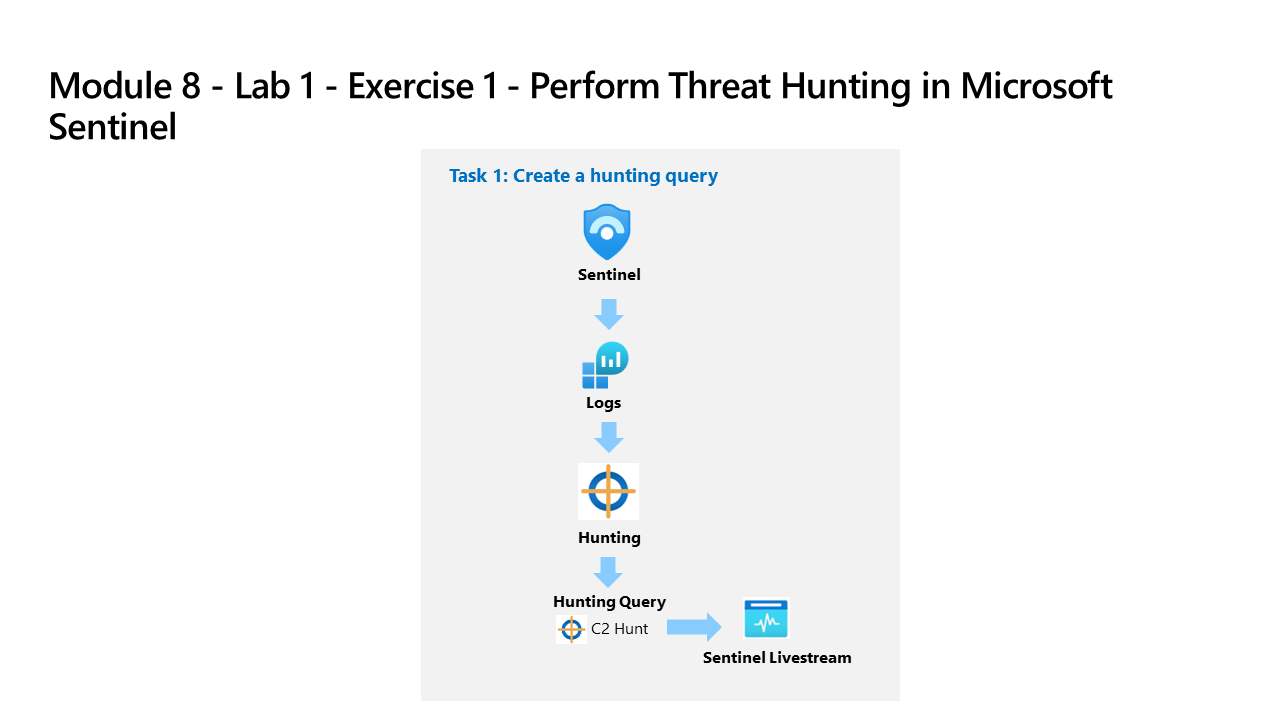
Task 1: Create a hunting query
In this task, you will create a hunting query, bookmark a result, and create a Livestream.
-
Log in to WIN1 virtual machine as Admin with the password: Pa55w.rd.
-
In the Edge browser, navigate to the Azure portal at https://portal.azure.com.
-
In the Sign in dialog box, copy and paste in the Tenant Email account provided by your lab hosting provider and then select Next.
-
In the Enter password dialog box, copy and paste in the Tenant Password provided by your lab hosting provider and then select Sign in.
-
In the Search bar of the Azure portal, type Sentinel, then select Microsoft Sentinel.
-
Select your Microsoft Sentinel Workspace.
-
Select Logs
-
Enter the following KQL Statement in the New Query 1 space:
Important: Please paste any KQL queries first in Notepad and then copy from there to the New Query 1 Log window to avoid any errors.
let lookback = 2d; SecurityEvent | where TimeGenerated >= ago(lookback) | where EventID == 4688 and Process =~ "powershell.exe" | extend PwshParam = trim(@"[^/\\]*powershell(.exe)+" , CommandLine) | project TimeGenerated, Computer, SubjectUserName, PwshParam | summarize min(TimeGenerated), count() by Computer, SubjectUserName, PwshParam | order by count_ desc nulls last -
Review the different results. You have now identified PowerShell requests that are running in your environment.
-
Select the checkbox of the results that shows the “-file c2.ps1”.
-
In the Results pane command bar, select the Add bookmark button.
-
Select + Add new entity under Entity mapping.
-
For Entity select Host, then Hostname and Computer for the values.
-
For Tactics and Techniques, select Command and Control.
-
In the Add bookmark blade, select Create. We will map this bookmark to an incident later.
-
Close the Logs window by selecting the X in the top-right of the window and select OK to discard the changes.
-
Select your Microsoft Sentinel workspace again and select the Hunting page under the Threat Management area.
-
Select the Queries tab and then + New Query from the command bar.
-
In the Create custom query window, for the Name enter PowerShell Hunt.
-
For the Custom query enter the following KQL statement:
let lookback = 2d; SecurityEvent | where TimeGenerated >= ago(lookback) | where EventID == 4688 and Process =~ "powershell.exe" | extend PwshParam = trim(@"[^/\\]*powershell(.exe)+" , CommandLine) | project TimeGenerated, Computer, SubjectUserName, PwshParam | summarize min(TimeGenerated), count() by Computer, SubjectUserName, PwshParam | order by count_ desc nulls last -
Scroll down and under Entity mapping select:
- For the Entity type drop-down list select Host.
- For the Identifier drop-down list select HostName.
- For the Value drop-down list select Computer.
-
Scroll down and under Tactics & Techniques select Command and Control and then select Create to create the hunting query.
-
In the “Microsoft Sentinel - Hunting” blade, search for the query you just created in the list, PowerShell Hunt.
-
Select PowerShell Hunt from the list.
-
Review the number of results in the middle pane under the Results column.
-
Select the View Results button from the right pane. The KQL query will automatically run.
-
Close the Logs window by selecting the X in the top-right of the window and select OK to discard the changes.
-
Right-click the PowerShell Hunt query and select Add to livestream. Hint: This also can be done by sliding right and selecting the ellipsis (…) at the end of the row to open a context menu.
-
Review that the Status is now Running. This will be running every 30 seconds in the background and you will receive a notification in the Azure Portal (bell icon) when a new result is found.
-
Select the Bookmarks tab in the middle pane.
-
Select the bookmark you just created from the results list.
-
On the right pane, scroll down and select the Investigate button. Hint: It might take a couple of minutes to show the investigation graph.
-
Explore the Investigation graph just like you did a the previous module. Notice the high number of Related alerts for WINServer.
-
Close the Investigation graph window by selecting the X in the top-right of the window.
-
Hide the right blade by selecting the » icon and then scroll right until you see the ellipsis (…) icon.
-
Select Add to existing incident. All the incidents appear in the right pane.
-
Select one of the incidents and then select Add.
-
Scroll left to notice that the Severity column is now populated with the incident’s data.
Task 2: Create a NRT query rule
In this task, instead of using a LiveStream, you will create a NRT analytics query rule. NRT rules run every minute and lookback one minute. The benefit to NRT rules are they can use the alert and incident creation logic.
-
Select the Analytics page under Configuration in Microsoft Sentinel.
-
Select the Create tab, then NRT query rule.
-
This starts the “Analytics rule wizard”. For the General tab type:
Setting Value Name NRT PowerShell Hunt Description NRT PowerShell Hunt Tactics Command and Control Severity High -
Select Next: Set rule logic > button.
-
For the Rule query enter the following KQL statement:
let lookback = 2d; SecurityEvent | where TimeGenerated >= ago(lookback) | where EventID == 4688 and Process =~ "powershell.exe" | extend PwshParam = trim(@"[^/\\]*powershell(.exe)+" , CommandLine) | project TimeGenerated, Computer, SubjectUserName, PwshParam | summarize min(TimeGenerated), count() by Computer, SubjectUserName, PwshParam -
Select View query results > to make sure your query does not have any errors.
-
Close the Logs window by selecting the X in the top-right of the window and select OK to discard the changes.
-
Select Test with current data under Results simulation. Notice the expected number of Alerts per day.
-
Under Entity mapping select:
- For the Entity type drop-down list select Host.
- For the Identifier drop-down list select HostName.
- For the Value drop-down list select Computer.
-
Scroll down and select Next: Incident settings> button.
-
For the Incident settings tab, leave the default values and select the Next: Automated Response > button.
-
On the Automated response tab, select the Next: Review and create > button.
-
On the Review and create tab, select the Save button to create and save the new Scheduled Analytics rule.
Task 3: Create a Search job
In this task, you will use a Search job to look for a C2.
Note: The Restore operation incurs costs that can deplete your Azure Pass subscription credits. For that reason, you will not be performing the restore operation in this lab. However, you can follow the steps below to perform the restore operation in your own environment.
-
Select the Search page under General in Microsoft Sentinel.
-
In the search box, enter reg.exe and then select Start.
-
A new window running the query opens. Select the ellipsis icon (…) from the top right and then toggle the Search job mode.
-
Select Search job button from the command bar.
-
The search job creates a new table with your results as soon as they arrive. The results can be consulted from the Saved Searches tab.
-
Close the Logs window by selecting the X in the top-right of the window and select OK to discard the changes.
-
Select the Restoration tab from the command bar and then the Restore button.
-
Under Select a table to restore, search for and select SecurityEvent.
-
Review the options available and then select the Cancel button.
Note: If you were running the job, the restore would run for a couple of minutes and your data would be available in a new table.