Learning Path 7 - Lab 1 - Exercise 3 - Create a Scheduled Query from a template
Lab scenario
You’re a Security Operations Analyst working at a company that implemented Microsoft Sentinel. You must learn how to detect and mitigate threats using Microsoft Sentinel. After connecting your data sources to Microsoft Sentinel, you create custom analytics rules to help discover threats and anomalous behaviors in your environment.
Analytics rules search for specific events or sets of events across your environment, alert you when certain event thresholds or conditions are reached, generate incidents for your SOC to triage and investigate, and respond to threats with automated tracking and reMediation processes.
Note: An interactive lab simulation is available that allows you to click through this lab at your own pace. You may find slight differences between the interactive simulation and the hosted lab, but the core concepts and ideas being demonstrated are the same.
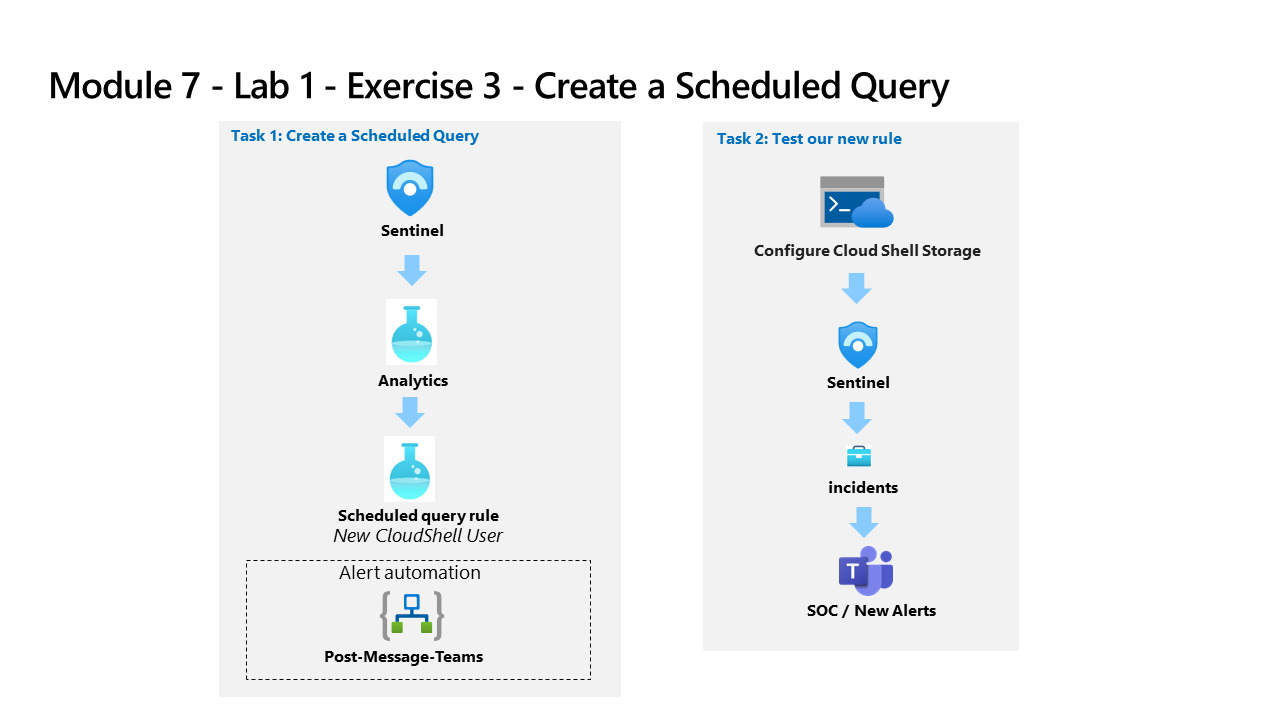
Task 1: Create a Scheduled Query
In this task, you create a scheduled query and connect it to the Teams channel you created in the previous exercise.
-
Log in to WIN1 virtual machine as Admin with the password: Pa55w.rd.
-
In the Sign in dialog box, copy and paste in the Tenant Email account provided by your lab hosting provider and then select Next.
-
In the Enter password dialog box, copy and paste in the Tenant Password provided by your lab hosting provider and then select Sign in.
-
In the Search bar of the Azure portal, type Sentinel, then select Microsoft Sentinel.
-
Select your Microsoft Sentinel Workspace.
-
Select Analytics from the Configuration area.
-
Make sure that you are in the Rule templates tab in the command bar and search for the New CloudShell User rule.
-
From the rule summary blade, make sure you’re receiving data by reviewing the green icon under Data sources: Azure Activity.
Note: If you do not see it in a connected state, make sure you completed Task 3 of the Learning Path 6 Lab, Exercise 1.
-
Select Create rule to continue.
-
In the Analytics rule wizard, on the General tab, change the Severity to Medium.
-
Select Next: Set rule logic > button:
-
For the rule query, select View query results. You shouldn’t receive any results nor any errors.
-
Close the Logs window by selecting the upper right X and select OK to discard to save changes to go back to the wizard.
-
Scroll down and under Query scheduling set the following:
Setting Value Run Query every 5 minutes Lookup data from the last 1 Days Note: We are purposely generating many incidents for the same data. This enables the Lab to use these alerts.
-
Under the Alert threshold area, leave the value unchanged since we want the alert to register every event.
-
Under the Event grouping area, leave the Group all events into a single alert as the selected option since we want to generate a single alert every time it runs, as long as the query returns more results than the specified alert threshold above.
-
Select the Next: Incident settings > button.
-
On the Incident settings tab, review the default options.
-
Select the Next: Automated response > button.
-
On the Automated response tab under Automation rules, select + Add new.
-
For the Automation rule name, enter Tier 2.
-
For the Actions, select Assign owner.
-
Then select Assign to me. Then select + Add action.
-
Use the And then drop-down menus to select Run playbook
-
A second drop-down menu appears with an Information (i) message regarding playbook permissions and a Manage playbook permissions link
Note: The playbooks will appear grayed out in the drop-down list until permissions are configured.
-
Select the Manage playbook permissions link
-
On the Manage Permissions page, select the RG-Playbooks resource group you created in the previous lab, and select Apply.
-
From the drop-down menu, select the playbook PostMessageTeams-OnIncident you created in the previous exercise.
-
Select Apply
-
Select the Next: Review and create > button.
-
Select Save.
Task 2: Test your new rule
In this task, you test your new scheduled query rule.
-
In the top bar of the Azure portal, Select the icon >_ that corresponds to the Cloud Shell. You might need to select the ellipsis icon first (…) if your display resolution is too low.
-
In the Welcome to Azure Cloud Shell window, select Powershell.
-
On the Getting started page, select Mount storage account, and then select your Azure Pass - Sponsorship from the storage account subscription drop-down menu item and select the Apply button.
Important: Do not select the No storage account required radio button option. This wil cause the incident creation to fail.
-
On the Mount storage account page, select We will create a storage account for you, and then select Next.
-
Wait until the Cloud Shell is provisioned, then close the Azure Cloud Shell window.
-
In the Search bar of the Azure portal, type Activity and then select Activity Log.
-
Make sure the following Operation name items appear: List Storage Account Keys and Update Storage Account Create. These are the operations that the KQL query you reviewed earlier will match to generate the alert. Hint: You might need to select Refresh to update the list.
-
In the Search bar of the Azure portal, type Sentinel, then select Microsoft Sentinel.
-
Select your Microsoft Sentinel Workspace.
-
Select the Incidents menu option under Threat management.
-
Select the Auto-refresh incidents toggle.
-
You should see the newly created Incident.
Note: The event that triggers the incident may take 5+ minutes to process. Continue with the next exercise, you will come back to this view later.
-
Select the Incident and review the information in the right blade.
-
Go back to Microsoft Teams by selecting the tab in your Microsoft Edge browser. If you closed it, just open a new tab and type https://teams.microsoft.com. Go to the SOC Teams, select the New Alerts channel and see the message post about the incident.