Learning Path 7 - Lab 1 - Exercise 10 - Create workbooks
Lab scenario
You are a Security Operations Analyst working at a company that implemented Microsoft Sentinel. Once you have connected your data sources to Microsoft Sentinel, you can visualize and monitor the data using the Microsoft Sentinel adoption of Azure Monitor Workbooks, which provides versatility in creating custom dashboards.
Microsoft Sentinel allows you to create custom workbooks across your data, and also comes with built-in workbook templates to allow you to quickly gain insights across your data as soon as you connect a data source.
Note: An interactive lab simulation is available that allows you to click through this lab at your own pace. You may find slight differences between the interactive simulation and the hosted lab, but the core concepts and ideas being demonstrated are the same.
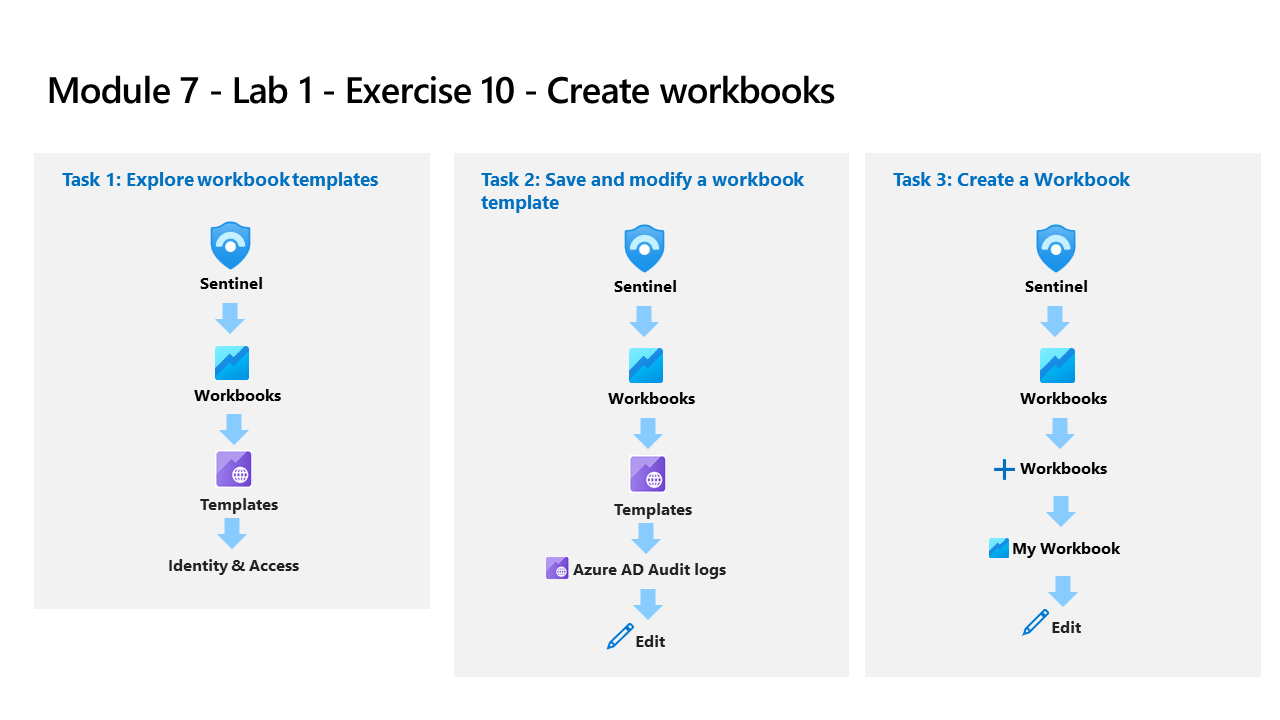
Task 1: Explore workbook templates
In this task, you will explore the Microsoft Sentinel workbook templates.
-
Login to WIN1 virtual machine as Admin with the password: Pa55w.rd.
-
In the Edge browser, navigate to the Azure portal at https://portal.azure.com.
-
In the Sign in dialog box, copy and paste in the Tenant Email account provided by your lab hosting provider and then select Next.
-
In the Enter password dialog box, copy and paste in the Tenant Password provided by your lab hosting provider and then select Sign in.
-
In the Search bar of the Azure portal, type Sentinel, then select Microsoft Sentinel.
-
Select your Microsoft Sentinel Workspace.
-
Select Workbooks under the Threat Management left blade. The Templates tab is selected by default.
-
Search for and select the Azure Activity template workbook. In the right pane, scroll down and select the View template button.
-
Review the contents of the workbook. It shows insights of your Azure subscription operations by collecting and analyzing the data from the Activity Log.
-
Close the workbook by selecting the X in the top-right corner.
Task 2: Save and modify a workbook template
In this task, you will save a workbook template and modify it.
-
You should be back in the Microsoft Sentinel - Workbooks - Templates tab. Scroll down again and select the Save button for the Azure Activity workbook.
-
Leave East US as the default value for Region and select OK.
-
Select the View saved workbook button.
-
Select Edit in the command bar to enable changes in the workbook.
-
Scroll down to the Caller activities over time area, look at the color of the Activities column since we are going to format those columns. Select the Edit button below the grid.
-
Select the Column Settings button, it is located to the right of the Run Query command bar. Hint: This button only appears if there is data from the KQL query.
-
In the Edit column settings blade that appears, within Columns select Activities.
-
Change the value for Column renderer to Heatmap. For Color palette, scroll down to select 32-color categorical.
-
Select Save and Close. Notice the change in the Activities column.
-
Select Done Editing at the bottom of the query (not the top menu).
-
Now select Done Editing at the top menu and select the Save icon.
-
Close the workbook by selecting the X in the top-right corner.
Task 3: Create a Workbook
In this task, you will create a new workbook with advanced visualizations.
-
You should be back at the Workbooks area of the Microsoft Sentinel portal.
-
Select + Add workbook to create a new workbook from scratch.
Note: Although it is a new workbook, a startup template is used.
-
To edit the workbook, select Edit.
-
Select the Edit button below the first paragraph of the workbook.
-
Type # My workbook in a new line on top of ## New workbook.
-
Select Done Editing on the bottom of this section, Editing text item: text - 2. Notice that your header increased size and name changed.
-
Select Edit below the only visible barchart graph.
-
Review the KQL statement that provides a union statement of counts across all tables.
-
Scroll down and select the Done Editing on the bottom menu, for the Editing query item: query - 2.
-
Select the ellipsis … next to the Edit button of the barchart graph, then select + Add, then select Add query.
-
Type SecurityEvent into the query box.
-
Change the Time Range to Last hour.
-
Change the Visualization to Time chart.
-
Select Style tab from the query’s command bar.
-
Select the Make this item a custom width box.
-
Set the Percent width to 25 and Maximum width to 25.
-
Now select Advanced Settings tab from the query’s command bar.
-
Select Show refresh icon when not editing box.
-
Scroll down and select Done Editing on the bottom menu, for the new Editing query item: query - 2.
-
Scroll down and at the bottom of the workbook select + Add, then Add query.
-
Type SecurityEvent into the query box.
-
Change the Time Range to Last hour.
-
Change the Visualization to Grid.
-
Select Style from the query’s command bar.
-
Select Make this item a custom width box.
-
Set the Percent width to 75 and Maximum width to 75.
-
Scroll down and select Done Editing on the bottom menu, for the new Editing query item: query - 3.
-
Select Done Editing in Workbook’s top command bar.
-
Select the Save icon, change the Title to My Workbook.
-
Select the RG-Defender resource group if needed and leave other values as default.
-
Select Apply to commit the changes.
-
Close the workbook by selecting the X at the top-right or select Workbooks in the Microsoft Sentinel portal.
-
Back in the Workbooks page, select the My workbooks tab.
-
Select the workbook you just created, My workbook.
-
On the right pane, select View saved workbook to review your workbook.