Create a Power BI Dashboard
Lab story
In this lab, you’ll create the Sales Monitoring dashboard in the Power BI service using an existing report.
In this lab you learn how to:
- Pin visuals to a dashboard
- Use Q&A to create dashboard tiles
This lab should take approximately 30 minutes.
Get started
To complete this exercise, first open a web browser and enter the following URL to download the zip folder:
https://github.com/MicrosoftLearning/PL-300-Microsoft-Power-BI-Data-Analyst/raw/Main/Allfiles/Labs/09-create-power-bi-dashboard/09-create-dashboard.zip
Extract the folder to the C:\Users\Student\Downloads\09-create-dashboard folder.
Publish the report
In this task, you’ll set up the environment for the lab by creating a semantic model.
-
In the Microsoft Edge browser window, in the Power BI service, navigate to My Workspace.
-
Select Import > Report or Paginated Report > From this computer.
-
Navigate to C:\Users\Student\Downloads\09-create-dashboard folder.
-
Select the 09-Starter-Sales Analysis.pbix file, and then select Open.
If prompted to replace the semantic model, select Replace it.
Create a dashboard
In this task, you’ll create the Sales Monitoring dashboard. You’ll pin a visual from the report, and add a tile based on an image data URI, and use Q&A to create a tile.
-
In the Power BI service, open the 09-Starter-Sales Analysis report.
-
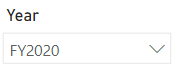
In the Overview page, set the Year slicer to FY2020.
-
Set the Region slicer to Select All.
Pinned visuals are set with the filter context at time of pin. If the underlying visual changes, you’ll need to update the dashboard tile as well. For time-based filters, it’s a better idea to use a relative date slicer (or, Q&A using a relative time-based question).
-
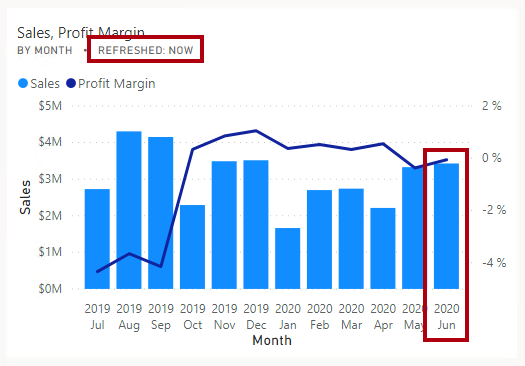
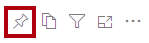
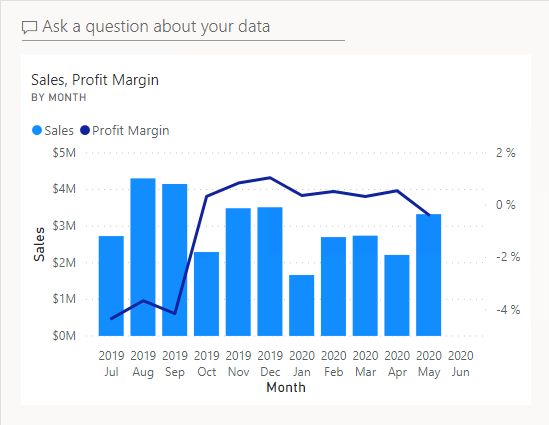
To create a dashboard and pin a visual, hover the cursor over the Sales and Profit Margin by Month (column/line) visual, and select the pushpin.
-
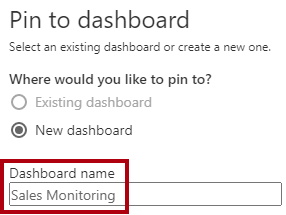
In the Pin to Dashboard window, in the Dashboard Name box, enter Sales Monitoring, then select Pin.
-
Open My Workspace and open the Sales Monitoring dashboard.
-
Notice that the dashboard has a single tile.
-
To add a tile based on a question, at the top-left of the dashboard, select Ask a Question About Your Data.
You can use the Q&A feature to ask a question, and Power BI will respond with a visual.

-
Select any one of the suggested questions beneath the Q&A box and review the response.
-
Remove all text from the Q&A box, and enter the following: Sales YTD
-
Notice the response of (Blank).
You may recall you added the Sales YTD measure in the Create Advanced DAX Calculations in Power BI Desktop lab. This measure is a Time Intelligence expression and so it requires a filter on the Date table to produce a result.

-
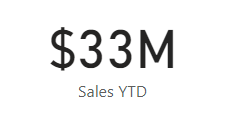
Extend the question with: in year FY2020.
-
Notice the response is now $33M.
-
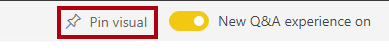
To pin the response to the dashboard, at the top-right corner, select Pin Visual.
-
When prompted to pin the tile to the Sales Monitoring dashboard, select Pin.
-
To return to the dashboard, at the top-left corner, select Exit Q&A.
-
To add the company logo, on the menu bar, select Edit, and then select Add a Tile.
Using this technique to add a dashboard tile lets you enhance your dashboard with media, including web content, images, richly formatted text boxes, and video (using YouTube or Vimeo links).
-
In the Add a Tile pane (located at the right), select the Image tile, then Next.
-
In the Add Image Tile pane, in the URL box, enter the complete URL found in the C:\Users\Student\Downloads\09-create-dashboard\AdventureWorksLogo_DataURL.txt file, and then Apply.
You can embed an image by using its URL, or you can use a data URL, which embeds content inline.
-
To resize the logo tile, drag the bottom-right corner, and resize the tile to become one unit wide, and one unit high.
Tile sizes are limited to a rectangular shape.
-
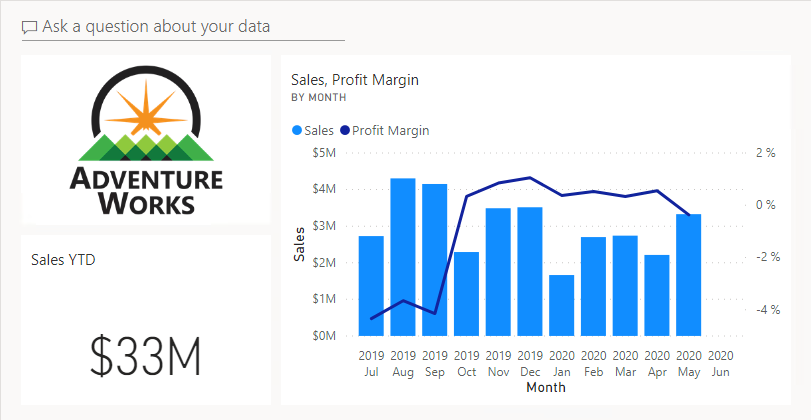
Organize the tiles so that the logo appears at the top-left, with the Sales YTD tile beneath it, and the Sales, Profit Margin tile at the right.
Edit tile details
In this task, you’ll edit the details of two tiles.
-
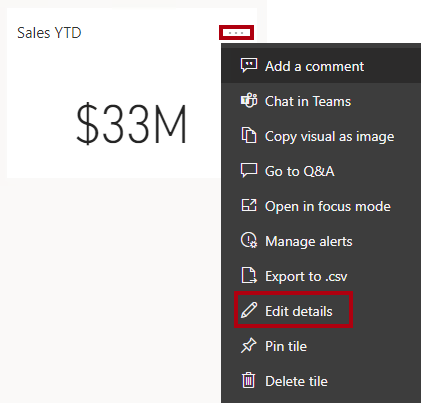
Hover the cursor over the Sales YTD tile, and then at the top-right of the tile, select the ellipsis, and then select Edit Details.
-
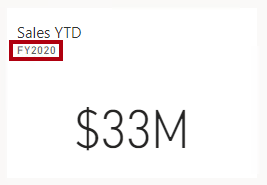
In the Tile Details pane (located at the right), in the Subtitle box, enter FY2020, and then select Apply.
-
Notice that the Sales YTD tile displays a subtitle.
-
Edit the tile details for the Sales, Profit Margin tile.
-
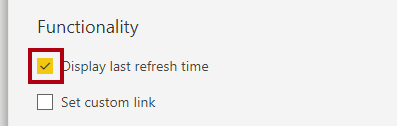
In the Tile Details pane, in the Functionality section, check Display Last Refresh Time, and then Apply.
-
Notice that the tile describes the last refresh time (which done when loading the data model in Power BI Desktop).
You’ll refresh the semantic model in the next exercise. Depending on your data and report, you can do an adhoc data refresh anytime or set a schedule. However, scheduled refreshes require gateways that we aren’t able to configure for this lab. So from Power BI Desktop, you’ll perform a manual data refresh, and then upload the file to your workspace.
Refresh the Semantic model
In this exercise, you’ll first load sales order data for June 2020 into the AdventureWorksDW2020 database. You’ll then open your Power BI Desktop file, perform a data refresh, and then upload the file to your workspace.
Note: If you’re unable to connect to the database, you can use the 09-Solution-Sales-Analysis.pbix file. Instead of updating the database and refreshing the semantic model, upload the solution file to My workspace and see the changes referenced in the following tasks.
Update the lab database
In this task, you’ll run a PowerShell script to update data in the AdventureWorksDW2020 database.
-
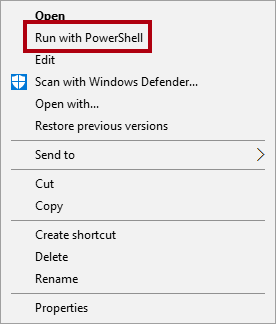
In File Explorer, inside the C:\Users\Student\Downloads\09-create-dashboard folder, right-click the UpdateDatabase-2-AddSales.ps1 file, and then select Run with PowerShell.
-
If prompted to change the execution policy, press A.
-
When prompted to press any key to close, press Enter again.
The AdventureWorksDW2020 database now includes sales orders made in June 2020.
Refresh the Power BI Desktop file
In this task you’ll open the 09-Starter-Sales Analysis Power BI Desktop file, perform a data refresh, and then upload the file to your Sales Analysis workspace.
-
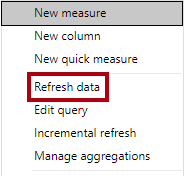
In Power BI Desktop file, in the Data pane, right-click the Sales table, and then select Refresh Data.
-
When the refresh completes, save the Power BI Desktop file.
-
To publish the file to your workspace, on the Home ribbon tab, from inside the Share group, select Publish and then select Select to publish.

-
When prompted to replace the semantic model, select Replace.
-
Close Power BI Desktop.
The semantic model in the Power BI service now has June 2020 sales data.
Review the dashboard
In this task, you’ll review the dashboard to notice updated sales.
-
In the Microsoft Edge browser window, open Power BI service, and then review the Sales Monitoring dashboard in My Workspace.
-
In the Sales, Profit Margin tile, in line with the subtitle, notice that the data was Refreshed: NOW.
-
Notice also that there’s now a column for 2020 Jun.
If you don’t see the June 2020 data, you might need to press F5 to reload the web browser.