Use DAX time intelligence functions in Power BI
Lab story
In this lab, you’ll create measures with DAX expressions that involve time intelligence.
In this lab, learn how to:
- Use various time intelligence functions to manipulate filter context that specific concerns dates.
This lab should take approximately 15 minutes.
Get started
To complete this exercise, first open a web browser and enter the following URL to download the zip file:
https://github.com/MicrosoftLearning/PL-300-Microsoft-Power-BI-Data-Analyst/raw/Main/Allfiles/Labs/06-use-dax-time-intelligence/06-time-intelligence.zip
Extract the file to the C:\Users\Student\Downloads\06-time-intelligence folder.
Open the 06-Starter-Sales Analysis.pbix file.
Note: You may see a sign-in dialog as the file loads. Select Cancel to dismiss the sign-in dialog. Close any other informational windows. Select Apply Later, if prompted to apply changes.
Create a YTD measure
In this task, you’ll create a sales year-to-date (YTD) measure by using time intelligence functions.
-
In Power BI Desktop, in Report view, on Page 2, notice the matrix visual that displays various measures with years and months grouped on the rows.
-
Add a measure to the
Salestable, based on the following expression, and formatted to zero decimal places:Sales YTD = TOTALYTD( SUM(Sales[Sales]), 'Date'[Date], "6-30" )The
TOTALYTDfunction evaluates an expression—in this case the sum of theSalescolumn—over a given date column. The date column must belong to a date table marked as a date table.The function can also take a third optional argument representing the last date of a year. The absence of this date means that December 31 is the last date of the year. For Adventure Works, June is in the last month of their year, and so “6-30” is used.
-
Add the
Salesfield and theSales YTDmeasure to the matrix visual. -
Notice the accumulation of sales values within the year.
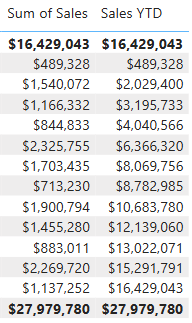
The
TOTALYTDfunction performs filter manipulation, specifically time filter manipulation. For example, to compute YTD sales for September 2017 (the third month of the fiscal year), all filters on theDatetable are removed and replaced with a new filter of dates commencing at the beginning of the year (July 1, 2017) and extending through to the last date of the in-context date period (September 30, 2017).Many time intelligence functions are available in DAX to support common time filter manipulations.
Create a YoY growth measure
In this task, you’ll create a sales YoY growth measure by using a variable.
Variables help you simplify the formula and are more efficient if using the logic multiple times within a formula. Variables are declared with a unique name, and the measure expression must then be output after the
RETURNkeyword. Unlike some other coding language variables, DAX variables can only be used within the single formula._
-
Add another measure to the
Salestable, based on the following expression:Sales YoY Growth = VAR SalesPriorYear = CALCULATE( SUM(Sales[Sales]), PARALLELPERIOD( 'Date'[Date], -12, MONTH ) ) RETURN SalesPriorYearThe
SalesPriorYearvariable is assigned an expression that calculates the sum of theSalescolumn in a modified context. That context uses thePARALLELPERIODfunction to shift 12 months back from each date in filter context. -
Add the
Sales YoY Growthmeasure to the matrix visual. -
Notice that the new measure returns
BLANKfor the first 12 months (because there were no sales recorded before fiscal year 2017). -
Notice that the
Sales YoY Growthmeasure value for 2018 Jul is the sales value for 2017 Jul.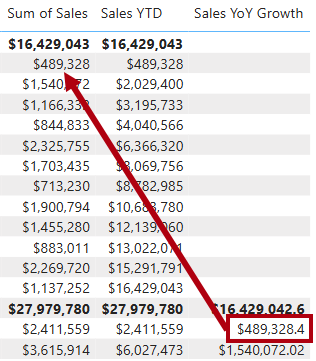
Now that the “difficult part” of the formula has been tested, you can overwrite the measure with the final formula that computes the growth result.
-
To complete the measure, overwrite the
Sales YoY Growthmeasure with this formula, formatting it as a percentage with two decimal places:Sales YoY Growth = VAR SalesPriorYear = CALCULATE( SUM(Sales[Sales]), PARALLELPERIOD( 'Date'[Date], -12, MONTH ) ) RETURN DIVIDE( (SUM(Sales[Sales]) - SalesPriorYear), SalesPriorYear ) -
In the formula, in the
RETURNclause, notice that the variable is referenced twice. -
Verify that the YoY growth for 2018 Jul is 392.83 percent.
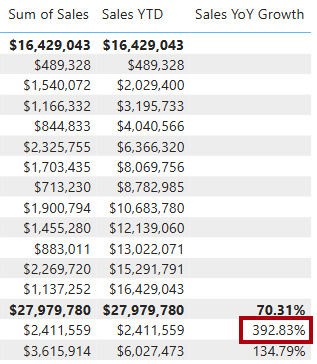
The YoY growth measure identifies almost 400 percent (or 4x) increase of sales during the same period of the previous year.
-
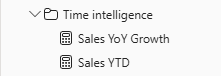
In Model view, place the two new measures into a display folder named Time intelligence.
-
Save the Power BI Desktop file.
Lab complete
You may choose to save your Power BI report, though it’s not necessary for this lab. In the next exercise, you’ll work with a pre-made starter file.
- Navigate to the “File” menu in the top left corner and select “Save As”.
- Select Browse this device.
- Select the folder where you want to save the file and give it a descriptive name.
- Select the Save button to save your report as a .pbix file.
- If a dialog box appears prompting you to apply pending query changes, select Apply.
- Close Power BI Desktop.