Create Visual Calculations in Power BI Desktop
Lab story
In this lab, you’ll create visual calculations using Data Analysis Expressions (DAX).
In this lab you learn how to:
- Create and edit visual calculations
- Use PREVIOUS(), RUNNINGSUM() and MOVINGAVERAGE() functions to create comparison metrics between each fiscal year
- Use the optional Axis parameter when creating comparison metrics.
- Use the optional Reset parameter to customize cumulative calculations in a multi-leveled axis.
This lab should take approximately 30 minutes.
Get started
To complete this exercise, first open a web browser and enter the following URL to download the zip folder:
https://github.com/MicrosoftLearning/PL-300-Microsoft-Power-BI-Data-Analyst/raw/Main/Allfiles/Labs/05b-create-visual-calculations-in-power-bi-desktop/05b-visual-calculations.zip
Extract the folder to the C:\Users\Student\Downloads\05b-visual-calculations folder.
Open the 05b-Starter-Sales Analysis.pbix file.
Note: You can dismiss the sign-in by selecting Cancel. Close any other informational windows. Select Apply Later, if prompted to apply changes.
Create a bar chart visual
In this task, you’ll create a bar chart showing sales amount, total product cost, and profit by fiscal year, with comparison metrics as tooltips.
-
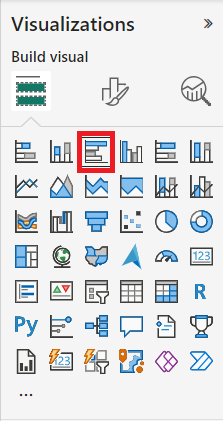
In the Visualizations pane, select the clustered bar chart visual type.
-
In the Data pane, from inside the Date table, drag the Year field into the Y-axis well/area.
-
Drag the Sales and Cost fields from the Sales table into the X-axis well/area.
Notice that when you added Sales and Cost to the visual, the sum of each field was automatically calculated.
-
Sort the resulting bar chart by Year ascending by using the three-dot menu and selecting Year followed by Sort ascending:
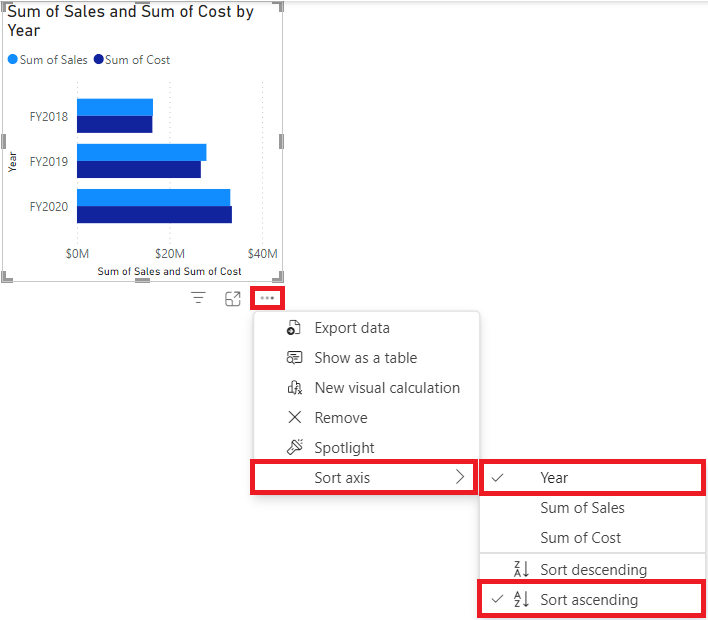
You now have a bar chart showing the Sum of Sales and Sum of Cost by Year sorted chronologically.
Add calculations
-
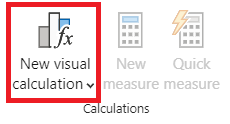
With the bar chart selected, select New visual calculation in the ribbon:
-
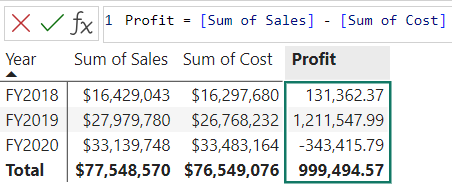
The visual calculations edit window opens. In the formula bar above the visual matrix enter the following expression and then Enter to commit the calculation:
Profit = [Sum of Sales] – [Sum of Cost] -
Confirm you now see a Profit column on the visual matrix at the bottom of the screen:
-
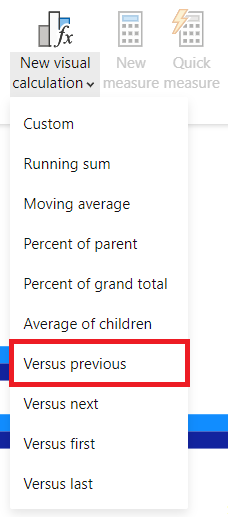
Expand the menu under New visual calculation and select Versus previous from the template options:
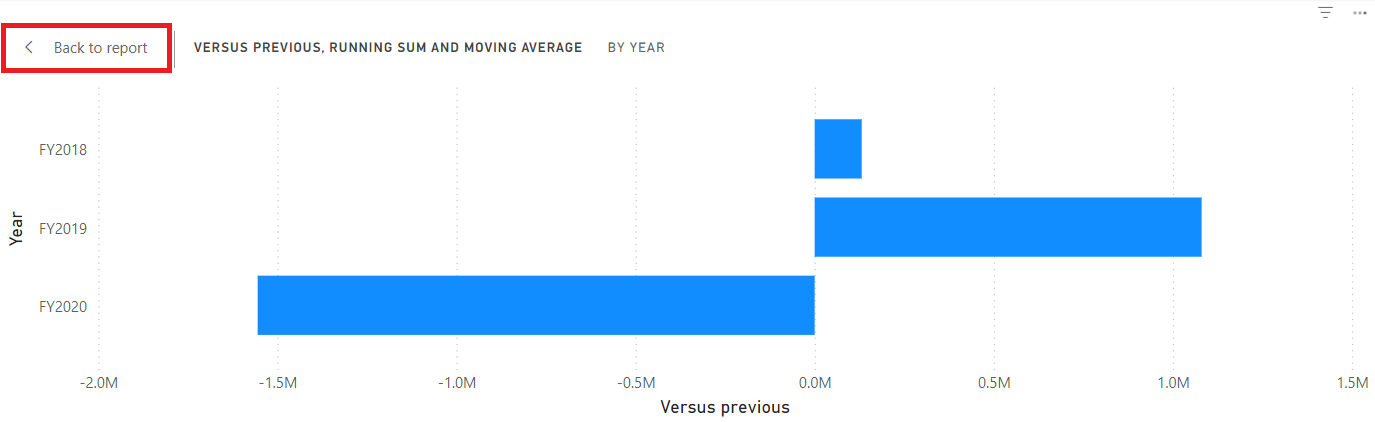
Versus Previous compares a value to a preceding value, so we see the Profit compared to the previous value for Year.
-
In the formula bar, replace the
[Field]placeholder with[Profit]twice and commit the calculation. -
Select Running sum from the templates menu and replace the
[Field]placeholder with[Profit]and commit the calculation.Running sum calculates the sum of values, adding the current value to the preceding values, so we see the total of current and previous years.
-
Select Moving average from the templates menu and replace the
[Field]placeholder with[Profit]and theWindowSizeplaceholder with 2. You should now have the following set up:Moving average calculates an average of a set of values in a given window by dividing the sum of the values by the size of the window. By setting the window size to 2, we are calculating the average of two consecutive values. In this example, the values are yearly profits, so we see the moving average for FY2019 is the average of the profits for FY2018 and FY2019.
-
Under the X-axis well/area, select the visibility icon of the following fields to hide them from the visual:
- Sum of Sales
- Sum of Cost
- Profit
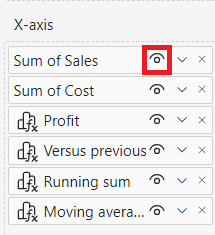
Notice how the fields and calculations you hid are now no longer shown on the visual.
-
In the Visualizations pane, drag Running sum and Moving average to the Tooltips well/area.
-
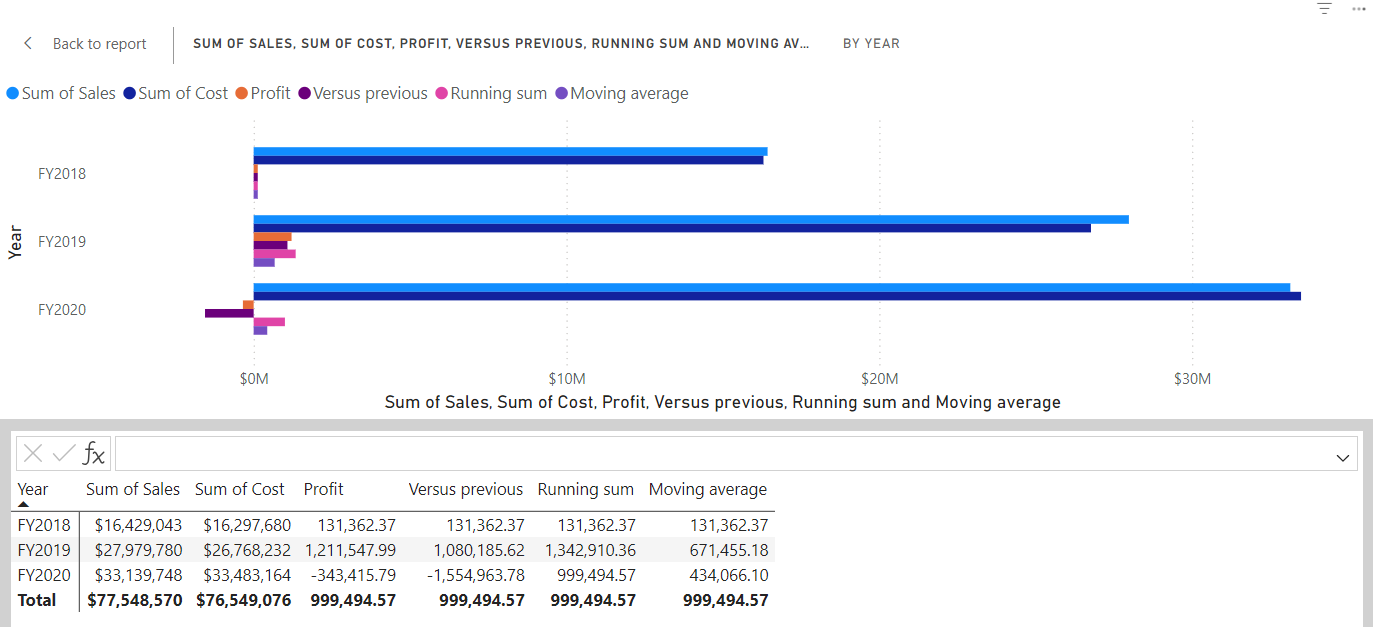
Confirm the visual now meets the goals. Exit out of the visual calculations edit screen to your report:
You now have a bar chart with the following values: Sum of Sales, Sum of Cost, Profit, and Profit versus previous with tooltips for Profit running sum and Profit moving average.
Create a matrix visual
In this task, you’ll create a matrix visual that compares the sales amount per category against the first fiscal year for each of the following years.
-
In Report view, create a new report page.
-
On Page 2, add a matrix visual.
-
Add the following fields to the visual wells/areas:
- Rows: Product | Category
- Columns: Date | Year
- Values: Sales | Sales
The labs use a shorthand notation to reference a field. It will look like this: Date | Year. In this example, Date is the table name and Year is the field name.
Add calculations
-
With the matrix selected, select New visual calculation in the ribbon.
-
In the visual calculations edit window, type and save the following calculation:
Versus first = [Sum of Sales] - FIRST([Sum of Sales])Notice how the matrix shows the difference in sales amount for each category versus the first category.
-
Select the field Versus first in the Values well/area and update your calculation by adding the ROWS value for the Axis parameter to FIRST:
Versus first = [Sum of Sales] - FIRST([Sum of Sales], ROWS)Notice how nothing changes as ROWS is the default value for the Axis parameter.
-
Replace ROWS with COLUMNS and observe that the calculation now compares the sales amount per category against the first fiscal year:
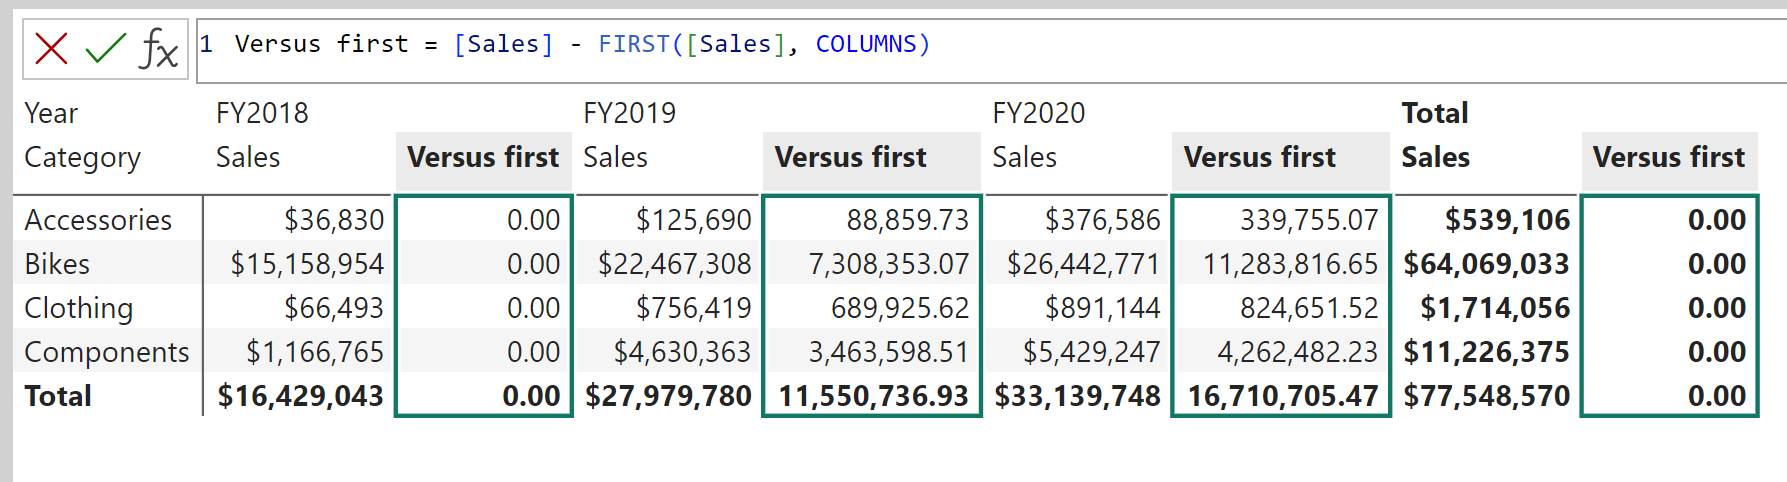
Notice how the Versus first column for the Total Sales returns zero instead of the difference against the first fiscal year. Total Sales is on a different hierarchical level than the yearly sums, and therefore, considered the first column on that level.
-
Exit out of the visual calculations edit screen to your report.
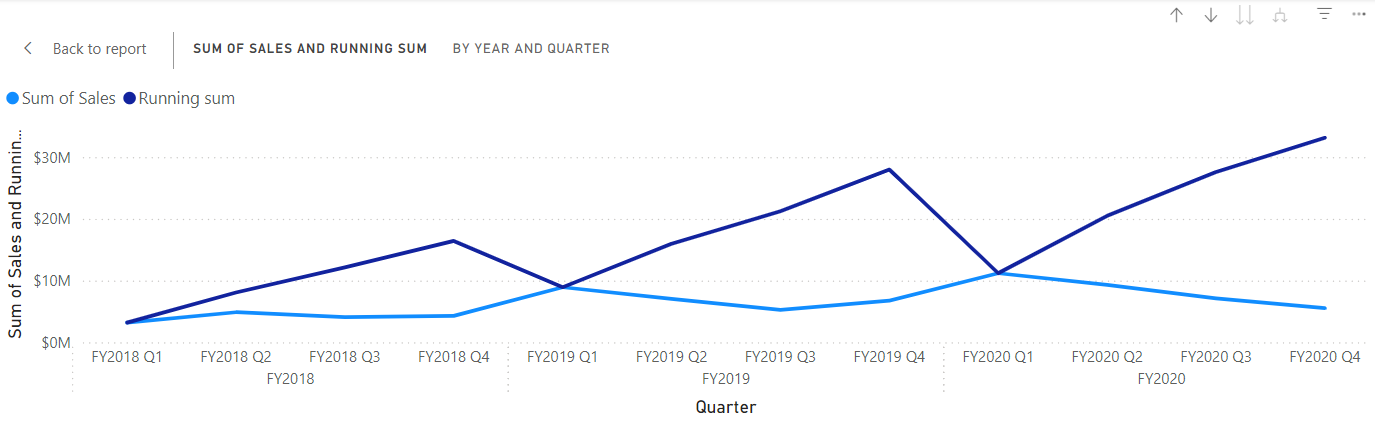
Create a line chart visual
In this task, you’ll create a line chart that shows the running sum for sales. This sum will reset at the beginning of every fiscal year.
-
In Report view, create a new report page.
-
On Page 3, add a line chart visual.
-
Add the following fields to the visual wells/areas:
- X-axis: Date | Year and Date | Quarter
- Y-axis: Sales | Sales
Add running sum
-
With the line chart selected, expand the menu under New visual calculation and select Running sum from the template options.
-
Replace the
[Field]placeholder with[Sum of Sales]and commit the change. The visual should look as follows: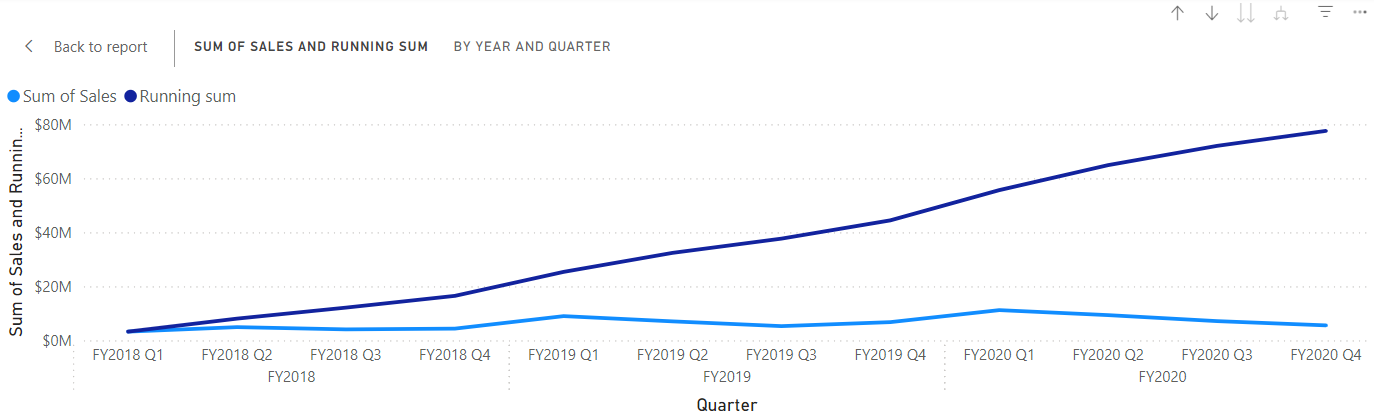
Update running sum to restart every new fiscal year
-
While still in the visual calculations edit window, select the Running sum field under Y-axis and update the expression for this calculation by adding the HIGHESTPARENT reset parameter and commit the changes:
Running sum = RUNNINGSUM([Sum of Sales], HIGHESTPARENT)
Verify that the running sum indeed restarts for every new fiscal year: