Load Transformed Data in Power BI Desktop
Lab story
In this lab, you’ll use data cleansing and transformation techniques to start shaping your data model. You’ll then apply the queries to load each as a table to the data model.
In this lab you learn how to:
- Apply various transformations
- Load queries to the data model
This lab should take approximately 45 minutes.
Get started
To complete this exercise, first open a web browser and enter the following URL to download the zip folder:
https://github.com/MicrosoftLearning/PL-300-Microsoft-Power-BI-Data-Analyst/raw/Main/Allfiles/Labs/02-load-data-with-power-query-in-power-bi-desktop/02-load-data.zip
Extract the folder to the C:\Users\Student\Downloads\02-load-data folder.
Open the 02-Starter-Sales Analysis.pbix file.
Note: You can dismiss the sign-in by selecting Cancel. Close any other informational windows. Select Apply Later, if prompted to apply changes.
Configure the Salesperson query
In this task, you’ll use Power Query Editor to configure the Salesperson query.
Important: When instructed to rename columns, it’s important that you rename them exactly as described.
-
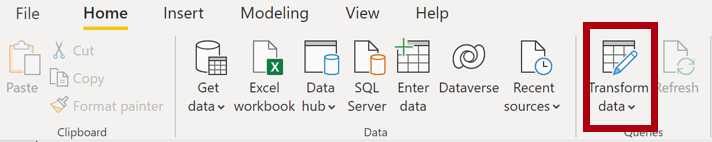
To open the Power Query Editor window, on the Home ribbon tab, from inside the Queries group, select the Transform Data icon.
-
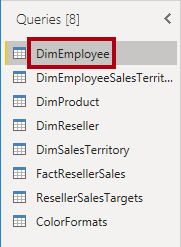
In the Power Query Editor window, in the Queries pane, select the DimEmployee query.
Note: If you receive a warning message asking to specify how to connect, select Edit Credentials, connect using current credentials, and select OK to use an unencrypted connection.
-
To rename the query, in the Query Settings pane (located at the right), in the Name box, replace the text with Salesperson, and then press Enter. Then verify the name has been updated in Queries pane.
The query name determines the model table name. It’s recommended to define concise and user-friendly names.
-
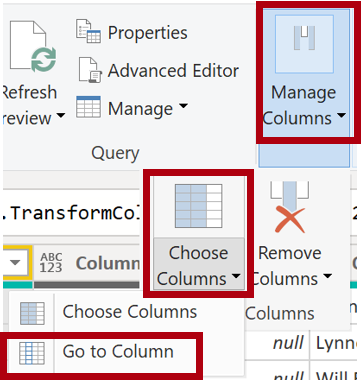
To locate a specific column, on the Home ribbon tab, select the Manage Columns down-arrow, select the Choose Columns down-arrow, and then select Go to Column.
Go to Column is a useful feature with many columns. Otherwise, you can horizontally scroll find columns.
-
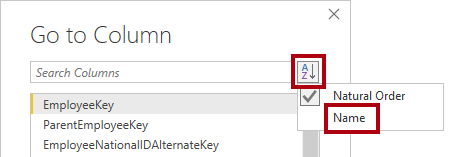
In the Go to Column window, to order the list by column name, select the AZ sort button, and then select Name and SalesPersonFlag. Click OK.
-
Locate the SalesPersonFlag column, then filter the column to select only Salespeople (that is, TRUE), and click OK.
-
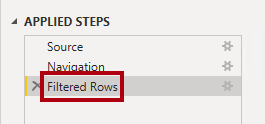
In the Query Settings pane, in the Applied Steps list, notice the addition of the Filtered Rows step.
Each transformation you create results in another step logic. It’s possible to edit or delete steps. It’s also possible to select a step to preview the query results at that stage of the query transformation.
-
To remove columns, on the Home ribbon tab, select the Manage Columns group, select the Choose Columns icon.
-
In the Choose Columns window, to uncheck all columns, uncheck the (Select All Columns) item.
-
To include columns, check the following six columns:
- EmployeeKey
- EmployeeNationalIDAlternateKey
- FirstName
- LastName
- Title
- EmailAddress
-
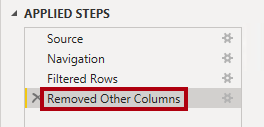
In the Applied Steps list, notice the addition of another query step.
-
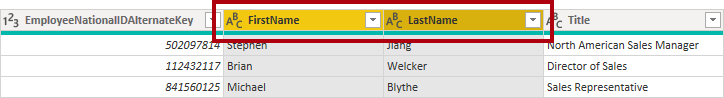
To create a single name column, first select the FirstName column header. While pressing the Ctrl key, select the LastName column.
-
Right-click either of the select column headers, and then in the context menu, select Merge Columns.
Many common transformations can be applied by right-clicking the column header, and then choosing them from the context menu. Note, however, more transformations are available in the ribbon.
-
In the Merge Columns window, in the Separator dropdown list, select Space.
-
In the New Column Name box, replace the text with Salesperson.
-
To rename the EmployeeNationalIDAlternateKey column, double-click the EmployeeNationalIDAlternateKey column header and replace the text with EmployeeID, and then press Enter.
-
Use the previous steps to rename the EmailAddress column to UPN.
UPN is an acronym for User Principal Name.
At the bottom-left, in the status bar, verify that the query has 5 columns and 18 rows.
Configure the SalespersonRegion query
In this task, you’ll configure the SalespersonRegion query.
-
In the Queries pane, select the DimEmployeeSalesTerritory query.
-
In the Query Settings pane, rename the query to SalespersonRegion.
-
To remove the last two columns, first select the DimEmployee column header.
-
While pressing the Ctrl key, select the DimSalesTerritory column header.
-
Right-click either of the select column headers, and then in the context menu, select Remove Columns.
In the status bar, verify that the query has 2 columns and 39 rows.
Configure the Product query
In this task, you’ll configure the Product query.
Important: When detailed instructions have already been provided, lab steps will provide more concise instructions. If you need the detailed instructions, you can refer back to the steps of previous tasks.
-
Select the DimProduct query and rename the query to Product.
-
Locate the FinishedGoodsFlag column, and then filter the column to retrieve products that are finished goods (that is, TRUE).
-
Remove all columns, except the following:
- ProductKey
- EnglishProductName
- StandardCost
- Color
- DimProductSubcategory
-
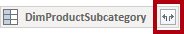
Notice that the DimProductSubcategory column represents a related table (it contains Value links).
-
In the DimProductSubcategory column header, at the right of the column name, select the expand button.
-
See the full list of columns, then select the Select All Columns box to unselect all columns.
-
Select EnglishProductSubcategoryName and DimProductCategory, and uncheck the Use Original Column Name as Prefix checkbox before selecting OK.
By selecting these two columns, a transformation will be applied to join to the DimProductSubcategory table, and then include these columns. The DimProductCategory column is, in fact, another related table in the data source.
Query column names must always be unique. If left checked, this checkbox would prefix each column with the expanded column name (in this case DimProductSubcategory). Because it’s known that the selected column names don’t collide with column names in the Product query, the option is deselected.
-
Notice that the transformation resulted in the addition of two columns, and that the DimProductSubcategory column has been removed.
-
Expand the DimProductCategory column, and then introduce only the EnglishProductCategoryName column.
-
Rename the following four columns:
- EnglishProductName to Product
- StandardCost to Standard Cost (include a space)
- EnglishProductSubcategoryName to Subcategory
- EnglishProductCategoryName to Category
In the status bar, verify that the query has 6 columns and 397 rows.
Configure the Reseller query
In this task, you’ll configure the Reseller query.
-
Select the DimReseller query and rename to Reseller.
-
Remove all columns, except the following:
- ResellerKey
- BusinessType
- ResellerName
- DimGeography
-
Expand the DimGeography column, to include only the following three columns:
- City
- StateProvinceName
- EnglishCountryRegionName
-
On the Business Type column header, select the down-arrow, and then review the distinct column values, and notice both values Warehouse and Ware House.
-
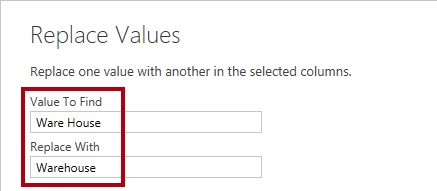
Right-click the Business Type column header, and then select Replace Values.
-
In the Replace Values window, configure the following values:
- In the Value to Find box, enter Ware House
- In the Replace With box, enter Warehouse
-
Rename the following four columns:
- BusinessType to Business Type (include a space)
- ResellerName to Reseller
- StateProvinceName to State-Province
- EnglishCountryRegionName to Country-Region
In the status bar, verify that the query has 6 columns and 701 rows.
Configure the Region query
In this task, you’ll configure the Region query.
-
Select the DimSalesTerritory query and rename the query to Region.
-
Apply a filter to the SalesTerritoryAlternateKey column to remove the value 0 (zero).
This will remove one row.
-
Remove all columns, except the following:
- SalesTerritoryKey
- SalesTerritoryRegion
- SalesTerritoryCountry
- SalesTerritoryGroup
-
Rename the following three columns:
- SalesTerritoryRegion to Region
- SalesTerritoryCountry to Country
- SalesTerritoryGroup to Group
In the status bar, verify that the query has 4 columns and 10 rows.
Configure the Sales query
In this task, you’ll configure the Sales query.
-
Select the FactResellerSales query and rename it to Sales.
-
Remove all columns, except the following:
- SalesOrderNumber
- OrderDate
- ProductKey
- ResellerKey
- EmployeeKey
- SalesTerritoryKey
- OrderQuantity
- UnitPrice
- TotalProductCost
- SalesAmount
- DimProduct
Note: You may recall in the Prepare Data in Power BI Desktop lab that a small percentage of FactResellerSales rows had missing TotalProductCost values. The DimProduct column has been included to retrieve the product standard cost column to assist fixing the missing values.
-
Expand the DimProduct column, uncheck all columns, and then include only the StandardCost column.
-
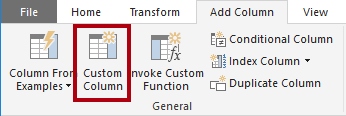
To create a custom column, on the Add Column ribbon tab, from inside the General group, select Custom Column.
-
In the Custom Column window, in the New Column Name box, replace the text with Cost.
-
In the Custom Column Formula box, enter the following expression (after the equals symbol), then save the new column:
` if [TotalProductCost] = null then [OrderQuantity] * [StandardCost] else [TotalProductCost] `
Note: You can copy the expression from the Snippets.txt file in the 02-load-data folder.
This expression tests if the TotalProductCost value is missing. If missing, it produces a value by multiplying the OrderQuantity value by the StandardCost value; otherwise, it uses the existing TotalProductCost value.
-
Remove the following two columns:
- TotalProductCost
- StandardCost
-
Rename the following three columns:
- OrderQuantity to Quantity
- UnitPrice to Unit Price (include a space)
- SalesAmount to Sales
-
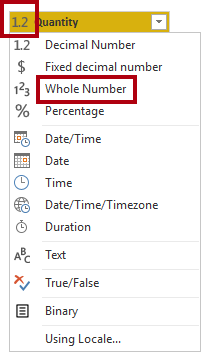
To modify the column data type, in the Quantity column header, at the left of the column name, select the 1.2 icon, and then select Whole Number.
Configuring the correct data type is important. When the column contains numeric value, it’s also important to choose the correct type if you expect to perform mathematic calculations.
-
Modify the following three column data types to Fixed Decimal Number.
The fixed decimal number data type allows for 19 digits, and allows for more precision to avoid rounding errors. It’s important to use the fixed decimal number type for financial values, or rates (like exchange rates).
- Unit Price
- Sales
- Cost
In the status bar, verify that the query has 10 columns and 999+ rows. A maximum of 1000 rows will be loaded as preview data for each query.
Configure the Targets query
In this task, you’ll configure the Targets query.
-
Select the ResellerSalesTargets query and rename to Targets.
Note: If you receive a warning message asking to specify how to connect, select Edit Credentials, and use anonymous access.
-
To unpivot the 12 month columns (M01-M12), first multi-select the Year and EmployeeID column headers.
-
Right-click either of the select column headers, and then in the context menu, select Unpivot Other Columns.
-
Notice that the column names now appear in the Attribute column, and the values appear in the Value column.
-
Apply a filter to the Value column to remove hyphen (-) values.
You may recall that the hyphen character was used in the source CSV file to represent zero (0).
-
Rename the following two columns:
- Attribute to MonthNumber (there’s no space)
- Value to Target
-
To prepare the MonthNumber column values, right-click the MonthNumber column header, and then select Replace Values.
You’ll now apply transformations to produce a date column. The date will be derived from the Year and MonthNumber columns. You’ll create the column by using the Columns From Examples feature.
-
In the Replace Values window, in the Value To Find box, enter M and leave the Replace with empty.
-
Modify the MonthNumber column data type to Whole Number.
-
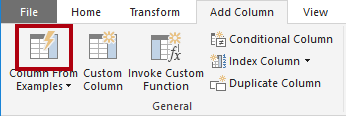
On the Add Column ribbon tab, from inside the General group, select The Column From Examples icon.
-
Notice that the first row is for year 2017 and month number 7.
-
In the Column1 column, in the first grid cell, commence entering 7/1/2017, and then press Enter.
Note: The virtual machine uses US regional settings, so this date is in fact July 1, 2017. Other regional settings may require a 0 before the date.
-
Notice that the grid cells update with predicted values.
The feature has accurately predicted that you’re combining values from the Year and MonthNumber columns.
-
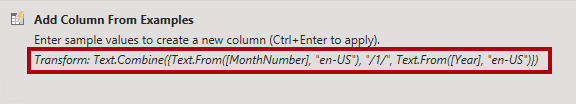
Notice also the formula presented above the query grid.
-
To rename the new column, double-click the Merged column header and rename the column as TargetMonth.
-
Remove the following columns:
- Year
- MonthNumber
-
Modify the following column data types:
- Target as fixed decimal number
- TargetMonth as date
-
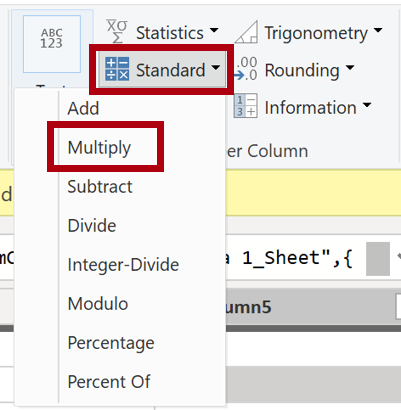
To multiply the Target values by 1000, select the Target column header, and then on the Transform ribbon tab, from inside the Number Column group, select Standard, and then select Multiply.
You may recall that the target values were stored as thousands.
-
In the Multiply window, in the Value box, enter 1000, and select OK.
In the status bar, verify that the query has 3 columns and 809 rows.
Configure the ColorFormats query
In this task, you’ll configure the ColorFormats query.
-
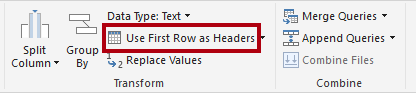
Select the ColorFormats query and notice that the first row contains the column names.
-
On the Home ribbon tab, from inside the Transform group, select Use First Row as Headers.
In the status bar, verify that the query has 3 columns and 10 rows.
Update the Product query
In this task, you’ll update the Product query by merging the ColorFormats query.
-
Select the Product query.
-
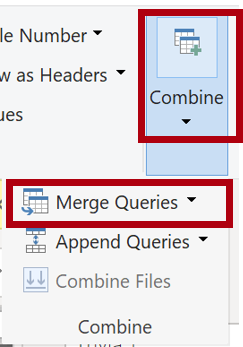
To merge the ColorFormats query, on the Home ribbon tab, select the Combine down-arrow, then select Merge Queries.
Merging queries allows integrating data, in this case from different data sources (SQL Server and a CSV file).
-
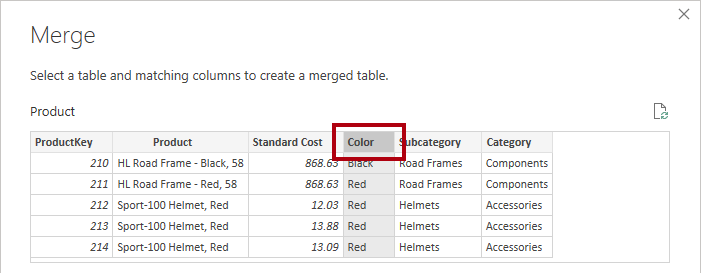
In the Merge window, in the Product query grid, select the Color column header.
-
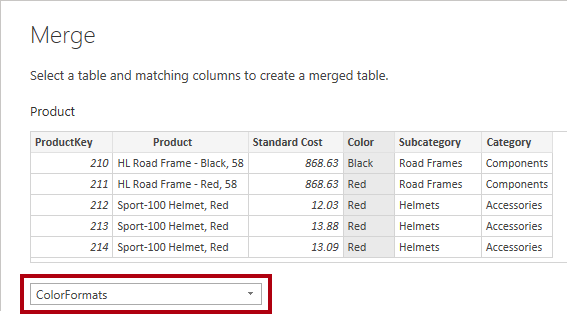
Beneath the Product query grid, in the dropdown list, select the ColorFormats query.
-
In the ColorFormats query grid, select the Color column header.
-
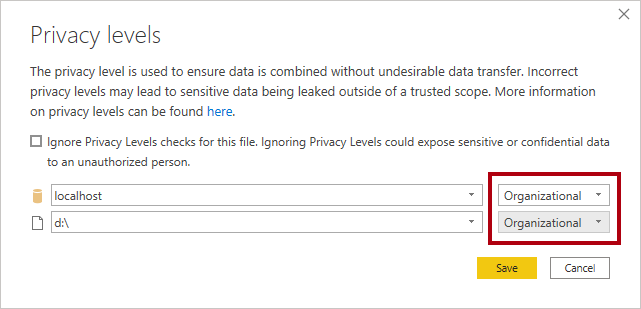
When the Privacy Levels window opens, for each of the two data sources, in the corresponding dropdown list, select Organizational, then Save.
Privacy levels can be configured for data source to determine whether data can be shared between sources. Setting each data source as Organizational allows them to share data, if necessary. Private data sources can never be shared with other data sources. It doesn’t mean that Private data can’t be shared; it means that the Power Query engine can’t share data between the sources.
-
In the Merge window, use the default Join Kind - maintaining the selection of Left Outer and select OK.
-
Expand the ColorFormats column to include the following two columns:
- Background Color Format
- Font Color Format
In the status bar, verify that the query now has 8 columns and 397 rows.
Update the ColorFormats query
In this task, you’ll update the ColorFormats to disable its load.
-
Select the ColorFormats query.
-
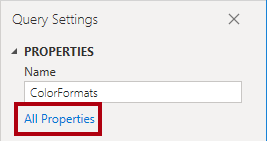
In the Query Settings pane, select the All Properties link.
-
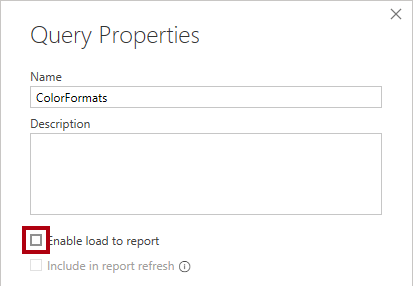
In the Query Properties window, uncheck the Enable Load To Report checkbox.
Disabling the load means it will not load as a table to the data model. This is done because the query was merged with the Product query, which is enabled to load to the data model.
Review final product
-
In Power Query Editor, verify that you have 8 queries, correctly named as follows:
- Salesperson
- SalespersonRegion
- Product
- Reseller
- Region
- Sales
- Targets
- ColorFormats (which won’t load to the data model)
-
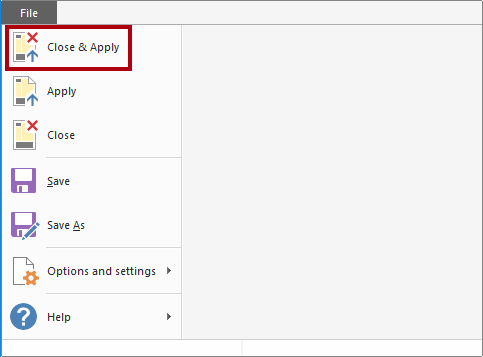
Select Close & Apply to load the data to the model, and close Power Query Editor window.
-
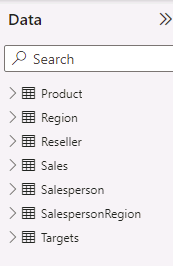
You can now see the canvas in Power BI Desktop, with Filters, Visualizations, and Data panes on the right. In the Data pane, notice the 7 tables loaded to the data model.