Get Data in Power BI Desktop
Lab story
This lab is designed to introduce you to Power BI Desktop application and how to connect to data and how to use data preview techniques to understand the characteristics and quality of the source data. The learning objectives are:
- Open Power BI Desktop
- Connect to different data sources
- Preview source data with Power Query
- Use data profiling features in Power Query
This lab should take approximately 30 minutes.
Get started with Power BI Desktop
To complete this exercise, first open a web browser and enter the following URL to download the zip folder:
https://github.com/MicrosoftLearning/PL-300-Microsoft-Power-BI-Data-Analyst/raw/Main/Allfiles/Labs/01-prepare-data-with-power-query-in-power-bi-desktop/01-prepare-data.zip
Extract the folder to the C:\Users\Student\Downloads\01-prepare-data folder.
Open the 01-Starter-Sales Analysis.pbix file.
-
This starter file has been specially configured to help you complete the lab. The following report-level settings have been disabled in the starter file:
- Data Load > Import relationships from data sources on first load
- Data Load > Autodetect new relationships after data is loaded
Get data from SQL Server
This task teaches you how to connect to a SQL Server database and import tables, which create queries in Power Query.
-
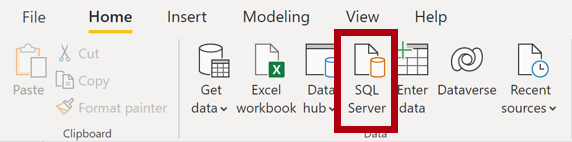
On the Home ribbon tab, from inside the Data group, select SQL Server.
-
In the SQL Server Database window, in the Server box, enter localhost and leave Database blank, then select OK.
Note: In this lab, you’ll connect to the SQL Server database by using localhost because gateway data sources can’t resolve localhost. This isn’t a recommended practice when creating your own solutions.
-
If prompted for credentials, select Windows > Use my current credentials, and then Connect.
-
Select OK if you receive a warning that an encrypted connection cannot be established.
-
In the Navigator pane, expand the AdventureWorksDW2020 database.
Note: The AdventureWorksDW2020 database is based on the AdventureWorksDW2017 sample database. It has been modified to support the learning objectives of the course labs.
-
Select the DimEmployee table, and notice the preview of the table data.
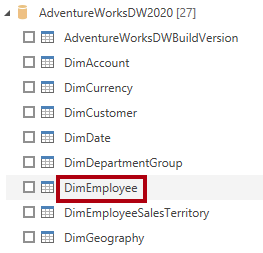
Note: The preview data allows you to see the columns and a sample of rows.
-
To import the table data, select the checkbox next to the following tables:
- DimEmployee
- DimEmployeeSalesTerritory
- DimProduct
- DimReseller
- DimSalesTerritory
- FactResellerSales
-
Complete this task by selecting Transform Data, which will open Power Query Editor - leave this open for the next task.
You’ve now connected to six tables from a SQL Server database.
Preview Data in Power Query Editor
This task introduces the Power Query Editor and allows you to review and profile the data. This helps you determine how to clean and transform the data later. You’ll also review both dimension tables prefixed with “Dim” and fact tables prefixed with “Fact”.
-
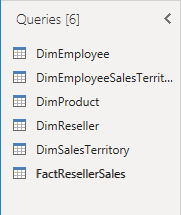
In the Power Query Editor window, at the left, notice the Queries pane. The Queries pane contains one query for each table you checked.
-
Select the first query—DimEmployee.
The DimEmployee table in the SQL Server database stores one row for each employee. A subset of the rows from this table represents the salespeople, which will be relevant to the model you’ll develop.
-
At the bottom left corner of the status bar, some table statistics are provided—the table has 33 columns, and 296 rows.

-
In the data preview pane, scroll horizontally to review all columns. Notice that the last five columns contain Table or Value links.
These five columns represent relationships to other tables in the database. They can be used to join tables together. You’ll join tables in the Load Transformed Data in Power BI Desktop lab.
-
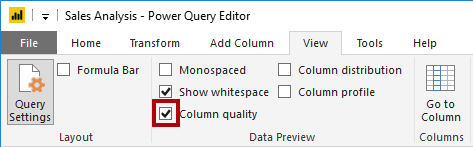
To assess column quality, on the View ribbon tab, from inside the Data Preview group, check Column Quality. The column quality feature allows you to easily determine the percentage of valid, error, or empty values found in columns.
-
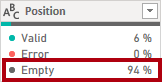
Notice that the Position column has 94% empty (null) rows.
-
To assess column distribution, on the View ribbon tab, from inside the Data Preview group, check Column Distribution.
-
Review the Position column again, and notice that there are four distinct values, and one unique value.
-
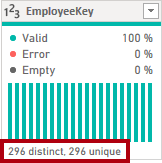
Review the column distribution for the EmployeeKey column—there are 296 distinct values, and 296 unique values.
Note: When the distinct and unique counts are the same, it means the column contains unique values. When modeling, it’s important that some model tables have unique columns. These unique columns can be used to create one-to-many relationships, which you’ll do in the Model Data in Power BI Desktop lab.
-
In the Queries pane, select the DimProduct query.
The DimProduct table contains one row per product sold by the company.
-
In the Queries pane, select the DimReseller query.
The DimReseller table contains one row per reseller. Resellers sell, distribute, or value add to the Adventure Works products.
-
To view column values, on the View ribbon tab, from inside the Data Preview group, check Column Profile.
-
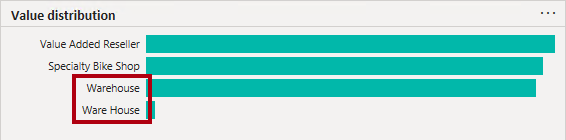
Select the BusinessType column header, and notice the new pane beneath the data preview pane. Review the column statistics and value distribution in the data preview pane.
Notice the data quality issue: there are two labels for warehouse (Warehouse, and the misspelled Ware House).
-
Hover the cursor over the Ware House bar, and notice that there are five rows with this value.
-
In the Queries pane, select the DimSalesTerritory query.
The DimSalesTerritory table contains one row per sales region, including Corporate HQ (headquarters). Regions are assigned to a country, and countries are assigned to groups. In the Model Data in Power BI Desktop lab, you’ll create a hierarchy to support analysis at region, country, or group level.
-
In the Queries pane, select the FactResellerSales query.
The FactResellerSales table contains one row per sales order line—a sales order contains one or more line items.
-
Review the column quality for the TotalProductCost column, and notice that 8% of the rows are empty.
Missing TotalProductCost column values is a data quality issue.
Get data from a CSV file
In this task, you’ll create a new query based on CSV files.
-
To add a new query, in the Power Query Editor window, on the Home ribbon tab, from inside the New Query group, select the New Source down-arrow, and then select Text/CSV.
-
Navigate to the 01-prepare-data > ResellerSalesTargets.csv file. Select Open.
-
In the ResellerSalesTargets.csv window, review the preview data. Select OK.
-
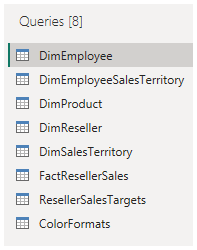
In the Queries pane, notice the addition of the ResellerSalesTargets query.
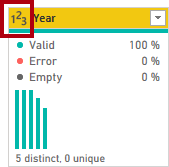
The ResellerSalesTargets CSV file contains one row per salesperson, per year. Each row records 12 monthly sales targets (expressed in thousands). The business year for the Adventure Works company commences on July 1.
-
Notice that no column contains empty values. When there isn’t a monthly sales target, a hyphen character is stored instead.
-
Review the icons in each column header, to the left of the column name. The icons represent the column data type. 123 is whole number, and ABC is text.
-
Repeat the steps to create a query based on the ColorFormats.csv file.
The ColorFormats CSV file contains one row per product color. Each row records the HEX codes to format background and font colors.
You should now have two new queries, ResellerSalesTargets and ColorFormats.