
Finance Demo
Scenario:
You're a financial analyst at Contoso evaluating sales performance and market positioning in the EV charging industry. You'll use Copilot to interrogate your sales data and surface the products, customers, and industries driving the business, benchmark those numbers against the wider market and key competitors, and then summarize the takeaways in a polished email to your team.
Demo Setup
The sample documents can be found in the MS-4021 GitHub repository here:
The specific files needed for this demo are:
NOTE: Allow up to 10 minutes for these files to sync to your OneDrive after downloading. To avoid delays during the demo, ensure these files are downloaded and available in your OneDrive well in advance. If the files are not available, open the documents and copy the shared file links to use in the demo.
Demos
Copilot in Excel
Use Copilot in Excel to analyze sales data, identify key trends, and calculate financial metrics.
Launch Excel and open EV_Charger_Sales_Analysis_v1.xlsx (either in your browser or desktop application).
Navigate to the Sales by Product tab.
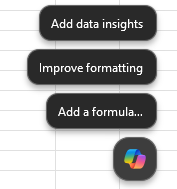
Select the Copilot icon in the bottom right hand corner of the document.
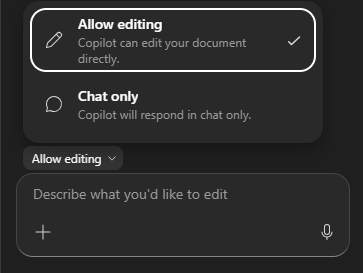
Ensure Allow editing is selected.
Use Copilot to sort the table by entering the following prompt:
textSort the table by date in descending order, from the most recent to the oldest entry.- Copilot sorts the table and updates the dataset.
- Select Apply after sorting.
Use Copilot to insert a total revenue column. Enter the following prompt in the Copilot pane:
textAdd a new column named 'Total Revenue'. Populate it by multiplying 'Units Sold' by 'Product Price' for each row.- Copilot creates the new column and applies the formula.
- Select Insert Column.
Use Copilot to generate a sales summary table for 2024. Enter the following prompt in the Copilot pane:
textCreate a summary table for total sales in 2024. The table should include Product ID, total units sold, and total revenue.- Copilot generates a summary table.
- Select Add to a new Data Sheet to store the table separately.
- Ensure the table includes only 2024 data.
- Navigate back to the Sales by Product tab or select Go back to data under Copilot's last response.
Use Copilot to identify the best-selling product. Enter the following prompt in the Copilot pane:
textIdentify the product ID with the highest total revenue in 2024. Provide both total revenue and total units sold for better comparison.- Copilot analyzes the dataset and provides the top-selling product.
- Navigate back to the Sales by Product tab or select Go back to data under Copilot's last response.
Use Copilot to sort customers by revenue.
- Navigate to the Customers sheet in Excel.
Enter the following prompt in the Copilot pane:
textSort the 'Customers' tab by annual revenue in descending order.- Copilot sorts the customers by annual revenue.
- Select Apply after sorting.
Use Copilot to calculate average revenue per customer. Enter the following prompt:
textCalculate the average revenue per customer.- Copilot calculates the average and adds the result.
- Select Insert Row to store the average revenue value.
Use Copilot to find the industry using the most power. Enter the following prompt in the Copilot pane:
textAnalyze the data to determine which industry has the highest total power consumption. Provide the industry name and total power usage.- Copilot processes the data and returns the industry with the highest power consumption.
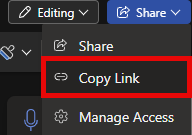
Save the document. Copy the shared URL from the document (enable AutoSave and select your OneDrive account if prompted).
Copilot Chat
Use Copilot Chat to compare financial performance with industry benchmarks and competitors.
Open a browser and navigate to M365copilot.com.
Ensure Web mode is selected.

In the prompt window, type the following:
textOur total revenue for [EV chargers] exceeded $50,000,000 for first half of 2024. Compare this to the industry average and provide insights on whether we are above or below industry standards. If possible, include market share estimates and trends.Now ask Copilot Chat to compare this to competitors:
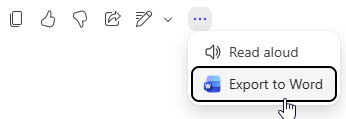
textSummarize the key financial statements of two major competitors in the [EV charging] industry. Include revenue, net profit, and any other relevant financial insights. If available, provide comparisons to our financial performance.Once you're happy with the draft, export the response directly to Word. At the bottom of Copilot's response, select the More options (…) menu and choose Export to Word.
NOTE: Copilot saves the response as a Word document in your OneDrive. Select Open Word to open the Word document in a new browser tab.
Select Enable Editing.
The file should have title similar to Charging_industry_Financial_Summary.docx. Copy the shared URL from the document (enable AutoSave and select your OneDrive account if prompted).
Copilot in Word
Use Copilot in Word to summarize financial insights into an email for our team.
Open a new Word document (either in your browser or desktop application).
In the Describe what you'd like to draft with Copilot? prompt box, type the following:
textDraft an email to my team summarizing the key insights from [Charging_industry_Financial_Summary.docx].NOTE: Attach the Charging_industry_Financial_Summary.docx file created in the previous task or paste the shared link directly into the prompt to ensure Copilot has access to the relevant content.
Review Copilot's output. Before selecting Keep it, refine the response by asking Copilot:
textShorten this email draftOther optional refinements:
- Ask Copilot to reword sections for a more professional tone.
- Expand with additional sections.
- Make it less formal.
Once finished, you can select Keep it.
Key Takeaway
In a single workflow, you turned raw sales data into a board-ready brief — using Edit with Copilot in Excel to surface top products, top customers, and the highest-consumption industries; Copilot Chat to benchmark those numbers against industry trends and competitor financials; and Copilot in Word to summarize the takeaways in a polished email to your team. Hours of pivot-table wrangling, research, and writing collapse into a focused, end-to-end analysis.