MB-500: Microsoft Dynamics 365: Finance and Operations Apps Developer
Lab 1: Work with trace and import it into the Trace Parser tool
Change Record
| Version | Date | Change |
|---|---|---|
| 1.0 | 23 Aug 2024 | Initial release |
| 1.1 | 10 Dec 2024 | Workaround for expired certificate |
| 1.2 | 15 Jan 2025 | Added business scenario |
| 1.3 | 19 Feb 2025 | Added The Why |
| 1.4 | 21 Aug 2025 | Version has been updated to 10.0.41 |
| 1.5 | 14 Oct 2025 | Instruction cleanup |
| 1.6 | 09 Feb 2026 | Clarifying instruction cleanup |
The Why
In the world of software development and system optimization, understanding how to work with trace files and import them into Trace Parser is a vital skill. This hands-on lab will equip you with the ability to analyze performance issues, debug complex problems, and optimize the efficiency of Microsoft Dynamics 365 Finance and Operations applications. By mastering these techniques, you’ll be able to identify bottlenecks, enhance system performance, and ensure a smoother user experience. This lab is not just an academic exercise; it’s a practical tool that will empower you to tackle real-world technical challenges with confidence and precision, ultimately contributing to the success of your development projects.
Business scenario
Business Scenario: Imagine you’re a developer working on Microsoft Dynamics 365 finance and operations apps. You’re tasked with investigating a performance issue reported by a user. The user is experiencing slow loading times when opening specific screens in the application.
How can the Hands-on Exercise Help? The hands-on exercise offers a step-by-step guide for using the Trace Parser tool to analyze system performance issues. By following the exercise, you’ll learn how to diagnose the performance issue and implement a solution to improve the application’s responsiveness.
Objective
This lab consists of three exercises. Requirements include a working development virtual machine (VM) with access to finance and operations apps, the Trace Parser tool, and SQL Server Management Studio (SSMS). For the lab:
-
In the first exercise, you’ll record a performance issue scenario with the Task recorder tool.
-
In the second exercise, you’ll import the downloaded file from Task recorder into Trace Parser.
-
In the last exercise, you’ll analyze records in Trace Parser.
Prerequisites
Note: If you get a “Your connection isn’t private” error on browser opening, then select the Advanced link, select to Continue, then wait 2-3 minutes.
To prepare for the exercises:
-
Select Windows and search for and open Trace Parser.
-
Enter a dot (.) in Server name, and then enter TraceDB in Select or enter a database name.
-
Select Register and Yes to create the database, and then select Capture Events. You may need to wait a bit for the providers to show. If they don’t show after a minute or two, Refresh Providers.
-
Verify Microsoft-Dynamics-AX-XppExecutionTraces and Microsoft-Dynamics-AX-ExecutionTraces events exist in the top three rows. If they do not exist, you must activate them. If they do, close Trace Parser and proceed to Exercise 1.
-
Open File Explorer and navigate to C:\AOSService\webroot\Monitoring.
-
Right-click DynamicsAXExecutionTraces.man to open the context menu, and then select Open with.
-
Select Try an app on this PC, and then select Notepad and select OK.
-
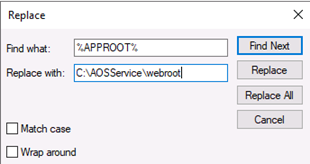
Select Edit and Replace, and then enter %APPROOT% in Find what.
-
Enter C:\AOSService\webroot in Replace with:
-
Select Replace All, select Cancel, close Notepad, and then select Save.
-
Right-click DynamicsAXXppExecutionTraces.man to open the context menu, and then select Open with.
-
Select Notepad, clear Always use this app to open .man files, and then select OK.
-
Select Edit and Replace, and then enter %APPROOT% in Find what.
-
Enter C:\AOSService\webroot in Replace with.
-
Select Replace All, select Cancel, close Notepad, and then select Save.
-
Open Windows PowerShell, selecting Run as administrator, and then enter each of the following, selecting Enter after each entry:
- wevtutil um "C:\\AOSService\\webroot\\Monitoring\\DynamicsAXExecutionTraces.man"
- wevtutil um "C:\\AOSService\\webroot\\Monitoring\\DynamicsAXXppExecutionTraces.man"
- wevtutil im "C:\\AOSService\\webroot\\Monitoring\\DynamicsAXExecutionTraces.man"
- wevtutil im "C:\\AOSService\\webroot\\Monitoring\\DynamicsAXXppExecutionTraces.man"
-
Close PowerShell.
-
Select Windows, and search for and open Trace Parser.
-
Select Capture Events, and then verify Microsoft-Dynamics-AX-XppExecutionTraces and Microsoft-Dynamics-AX-ExecutionTraces events exist in the top three rows

If the events exist, the Trace is working. Close Trace Parser.
Exercise 1: Create a trace using Task recorder
To create a trace using the Task recorder tool:
-
Open Microsoft Edge in your VM.
-
Go to Dashboard – Finance and Operations (dynamics.com) and sign in to the finance and operations apps with your account.
-
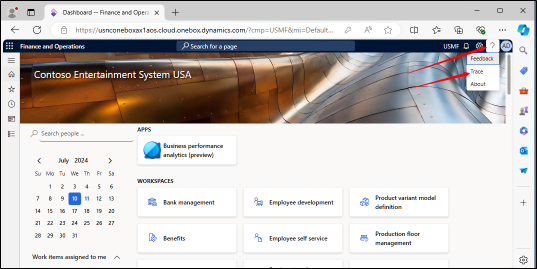
Select the question mark on the upper-right of the Edge window, and then select Trace.
-
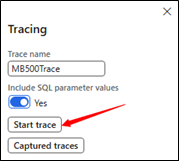
Enter the following when the Tracing dialog opens, and then select Start trace:
-
Trace name: MB500Trace
-
Include SQL parameter values: Yes
-
-
Notice that the trace is running, and leave the window open
 In this scenario, users have reported that sales orders are working slowly, so you’ll need to review the sales order lines and check reservations against on-hand supply.
 -
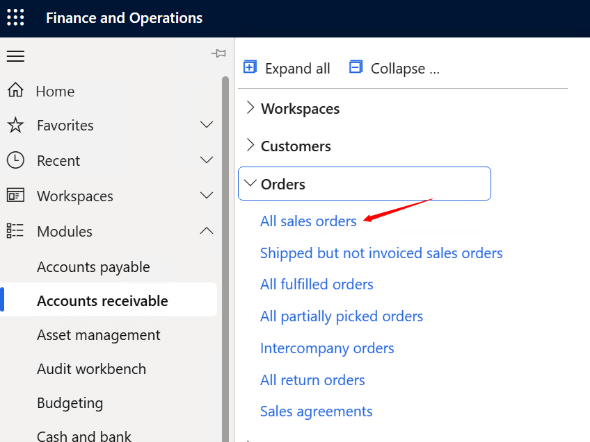
In the Navigation pane, select Modules, and then select Accounts receivable.
-
In the menu for Accounts receivable, select the Orders menu, and then select All sales orders
-
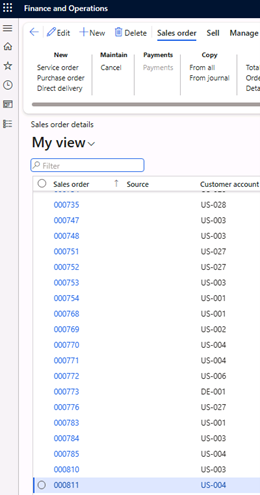
Select the last sales order in the list and the lines will open
-
In Sales order details > Sales order lines, select Inventory in the group’s Action pane.

-
Select Reservation to check the reservation against on-hand supply.
-
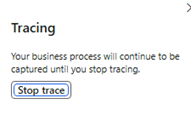
Stop the trace by selecting Stop trace.
-
Note: You may download or upload the trace after it stops. Uploading a trace saves it in finance and operations apps, from which you then can download it repeatedly.
Important: If you download a trace without uploading it first, the trace is deleted.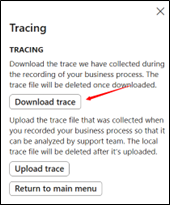
-
Select Download trace, and the trace is stored in the Downloads folder on the VM.
Exercise 2: Import the downloaded trace into Trace Parser
To import a trace you’ve downloaded into the Trace Parser tool:
-
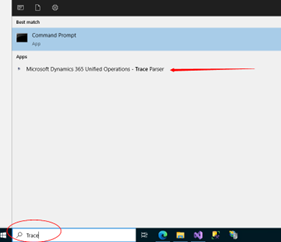
Select Start in your VM and then enter Trace in the search field
-
Select the Microsoft Dynamics 365 Unified Operations – Trace Parser.
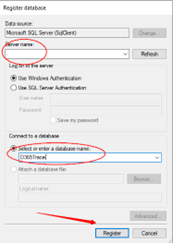
If this is your first time using the Trace Parser tool, no database is registered, so you’ll receive a prompt to create one:
-
Enter the following to create a database on the local VM:
-
Server name: . (type in a dot for local server)
-
Select or enter a database name: D365Trace
-
-
Select Register to create the database for the trace file.
-
If the database name doesn’t exist in SQL Server, a prompt will appear with the message “The specific database does not exist. Would you like to create it?”
-
Select Yes to create the database.
-
-
Select Import Trace and navigate to the trace file (Downloads folder), and then select it.
-
Select Open to import the file:
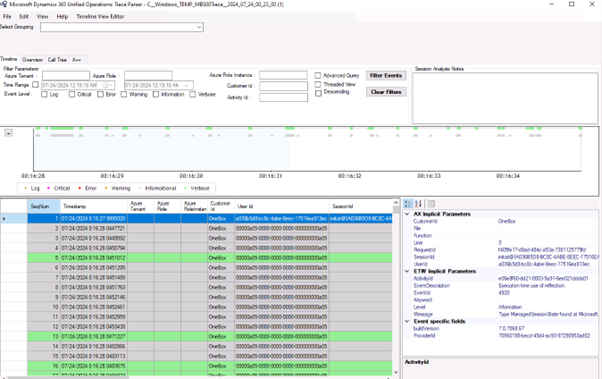
The import process will take a few minutes.
Exercise 3: Analyze in Trace Parser
To analyze X++ and SQL for users in the Trace Parser tool:
-
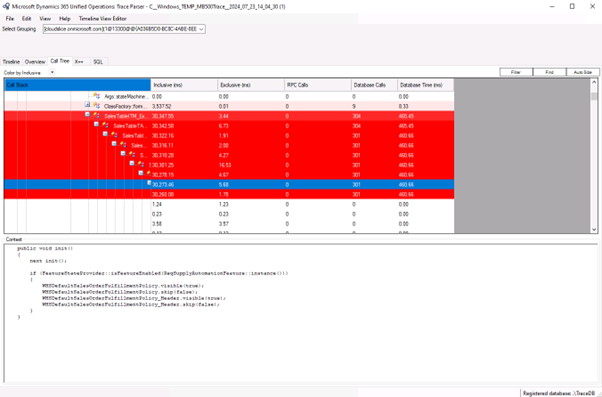
Select the Select Grouping option, and then select your applicable user account. It will be similar to the username you used, for example, cloudslice, and not OneBox. The trace parser will filter for your specific user.
-
Select the Call Tree tab to see the call stack, and then move down to find the reddest color.
-
Expand the tree node for the reddest color (the largest number of ms) and continue until all nodes for that one path are expanded, and make sure you’re watching the Context field to see the X++ code. For the purposes of this exercise, it’s not necessary to dive fully down, but several levels are advised.
-
Switch from the Call tree tab to the X++ one, and then select the Total Inclusive (ms) column to sort the most expensive in descending order.
-
Find the first row with code to see the most expensive code, and then switch to the SQL tab.
-
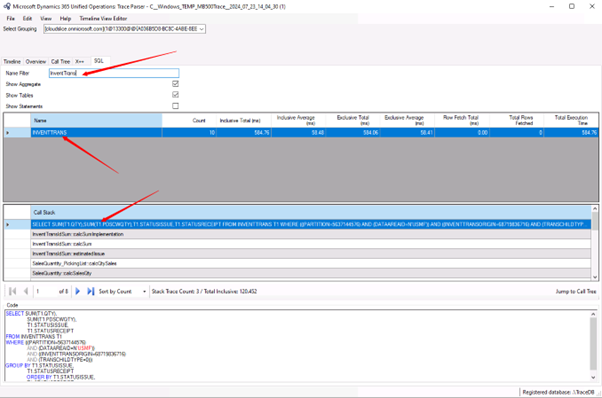
Select Show Tables, and then enter SalesTable in Name Filter. Only SQL statements visible on SalesTable should be listed.
-
Enter InventTrans in Name Filter. Only SQL statements with InventTrans should now be listed in the view
-
Select Jump to Call Tree (lower right between the Call Stack and Code) and wait. Trace Parser goes to Call Tree, and you can see the call stack. This will provide valuable information for identifying the expensive query.
-
You now can evaluate options such as rewriting the query or the code which calls it, creating indexes, or other.