Exercise 02: Monitor an Azure Linux virtual machine
Lab requirements
This lab requires an Azure virtual machine. If you don’t have a virtual machine, there are optional instructions to create one.
This lab requires an Azure subscription. Your subscription type may affect the availability of features in this lab. You may change the region, but the steps were tested using the (US) East region.
Estimated timing: 45 minutes
Lab scenario
Your organization is migrating their virtual machine workloads to Azure. It is important that you are notified of any significant infrastructure changes. You plan to explore the capabilities of Azure Monitor, including alerts and Log Analytics.
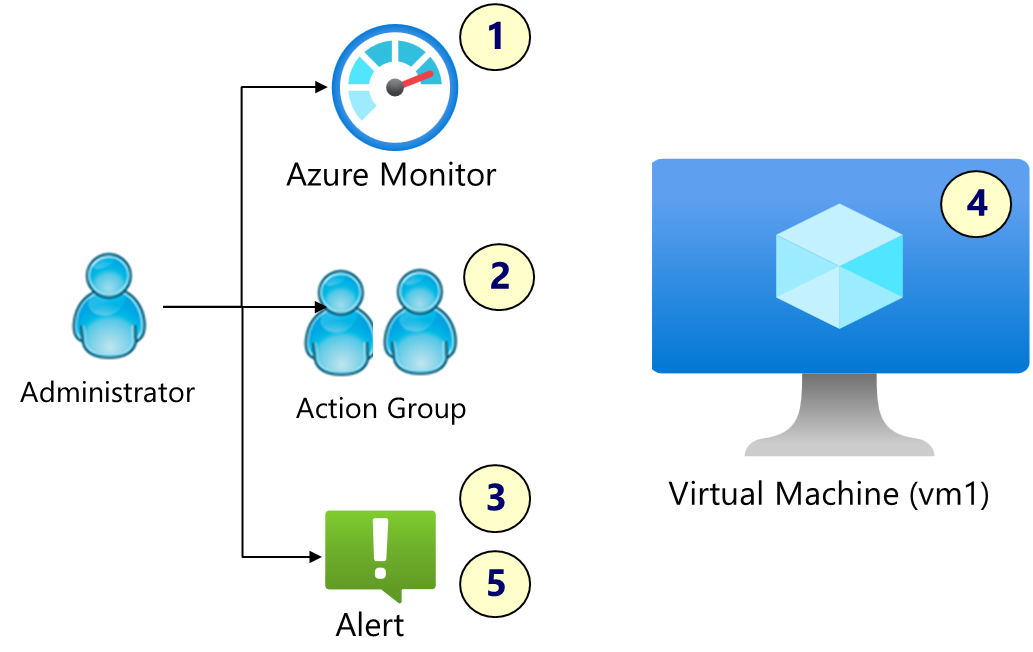
Architecture diagram
Job skills
- Skill 0: Create a virtual machine (import a template).
- Skill 1: Configure VM Insights.
- Skill 2: Configure action groups and notifications.
- Skill 3: Create alerts.
- Skill 4: Trigger an alert by resizing the virtual machine.
- Skill 5: Configure an alert processing rule (optional).
Skill 0: Create a virtual machine (import a template)
Note: Templates are available in the download directory.
In this task, you will use a template to deploy a virtual machine.
-
Download the \Allfiles\Lab02\ lab files.
-
Sign in to the Azure portal,
https://portal.azure.com. -
Cancel the Welcome to Microsoft Azure splash screen.
-
Search for and select
Deploy a custom template. -
On the custom deployment page, select Build you own template in the editor.
-
On the edit template page, select Load file.
-
Locate and select the \Allfiles\Lab02\azuredeploy.json file and select Open.
Note: Take a moment to review the template. We are deploying a virtual network with a Linux virtual machine.
-
Save your changes.
-
Use the following information to complete the custom deployment fields, leaving all other fields with their default values:
Setting Value Subscription Your Azure subscription Resource group RG1(If necessary, select Create new)Region (US) East US Vm name VM2Username adminuserPassword Provide a complex password (make a note of this, you will need it later) -
Select Review + Create, then select Create.
Skill 1: Configure VM insights
In this task, you will enable Insights for a virtual machine.
-
Continue in the Azure portal.
-
Search for and select your virtual machine. Before proceeding, ensure the VM status is Running.
-
In the Monitoring section, select Insights (now Monitor).
VM insights is a method for monitoring the client workloads on your virtual machines and virtual machine scale sets. VM Insights collects performance data, displays an inventory of your existing VMs, and provides a guided experience to enable base monitoring for them.
-
On the Unlock enhanced monitoring banner, select Configure.
-
On the Capabilities tab, uncheck Enable recommended alerts, review the default settings. If prompted, accept the default Azure Monitor workspace and Log Analytics workspace values.
-
Select the Review + enable tab, and then select Enable.
-
It may take a couple of minutes for VM Insights to deploy.
-
You do not need to wait for the deployment to finish, continue on.
Check your learning.
- Can you enable VM Insights on a virtual machine?
- Can you use the Configure workflow to enable enhanced monitoring?
- Can you select a specific Log Analytics workspace?
Skill 2: Configure action groups
In this task, you will create an action group and configure a notification method.
-
Continue working on your virtual machine. In the Monitoring section, select Alerts.
-
Select + Create and then Action group.
Action groups are a collection of notification preferences and actions. You can add up to five action groups to an alert rule. Action groups are executed concurrently, in no specific order. Multiple alert rules can use the same action group.
-
On the Basics tab, enter the following values for each setting.
Setting Value Project details Subscription your subscription Resource group RG1 Region Global (default) Instance details Action group name Help Desk(must be unique in the resource group)Display name Help Desk -
Select Next: Notifications >. Notifications determine how the action group is alerted. We will be using email notifications.
Setting Value Notification type Select Email/SMS message/Push/Voice -
Select Email, and in the Email box, enter your email address, and then select OK.
You should receive an email notification saying you were added to an action group. There may be a few minutes delay.
-
Complete the Notifications tab by adding a Name for the action group,
Help Desk. -
Finish creating the action group by selecting Review + Create and then Create.
Check your learning.
- Can you create an alert action group?
- Can you configure how the action group is notified when an alert is triggered?
Skill 3: Create alerts
In this task, you will create two alert rules.
-
In the Monitor section, select Alerts.
Virtual machine alerts are automated notifications in Azure Monitor that provide insights into the status of Azure resource. There are no preconfigured alert rules for virtual machines, but there is a set of recommended alert rules you can enable. Or you can just create your own.
-
Select + Create and select Alert rule.
Create an alert rule based on CPU percentage usage
-
In the Signal name drop-down select Percentage CPU.
-
You want to be alerted when the CPU threshold is over 90%. So, change the Threshold value to
90.Alerts can be based on metrics. Metrics are numerical values that are automatically collected at regular intervals and describe some aspect of a resource. For example, this metric would tell you the processor utilization of a virtual machine.
-
You also need to adjust the When to evaluate settings. It is important to be reasonable about how often the alert is checked.
Setting Value Loopback period 1 hourCheck every 1 hour -
Select Next: Actions> tab, Select action groups, then choose the Help Desk action group and click Select.
-
Move to the Details tab, complete the required information.
Setting Value Severity 2 - WarningAlert rule name VM2CPUAlert -
Select Review + create, then select Create.
Create an alert based on log activity
-
Select + Create and select Alert rule.
-
On the Condition tab select See all signals.
-
Search for and select Create or update virtual machine (Virtual Machines). Apply your changes.
This alert is based on information from a log search. Logs are stored in a Log Analytics workspace.
-
In the Alert logic area (scroll down) review the Event level selections. Leave the default of All selected.
-
Review the Status drop-down selections. Leave the default of All selected.
-
On the Actions tab, select Select action groups, then choose the Help Desk action group and click Select.
This exercise uses an action group, but an alert doesn’t require an action group.
-
Move to the Details tab and enter the following values for each setting.
Setting Value Alert rule name VM2changedAlert rule description VM2 was updated or deleted. -
Select Review + create, then select Create.
Check your learning.
- Can you create a virtual machine alert based on metrics?
- Can you create a virtual machine alert based on log activity?
- Can you assign an action group to an alert?
Skill 4: Trigger an alert by resizing the virtual machine
In this task, you will review performance data and resize a virtual machine.
-
Continue working with your virtual machine.
- In the Monitoring section select the Metrics blade. Take a few minutes to explore.
- You can create a variety of different charts, like a Line chart.
- You can Scope the chart to include one or more virtual machines.
- You can select the Metrics to include in the chart.
- You can create a New alert rule from your data.
- You can Save to the dashboard.
-
In the Monitoring section select the Logs blade. If a Get more visibility enable page appears, select the button to open Log Analytics. If a Welcome to Log Analytics splash screen appears, close it. Take a few minutes to explore.
- In the Queries hub dialog, select the Virtual Machines category tab to browse built-in queries.
- Notice there are a large number of built-in queries that might be of interest. For example, the Count heartbeats or Virtual Machine available memory.
- Take time to explore and Run any queries of interest.
- Depending on the virtual machine activity, there may not be a lot of events.
-
Based on your monitoring review you learn the CPU percentage is close to being maxed out. You decide to increase the number of CPUs.
You can scale the VM up or down by changing the VM size. In some cases, you must deallocate the VM first.
-
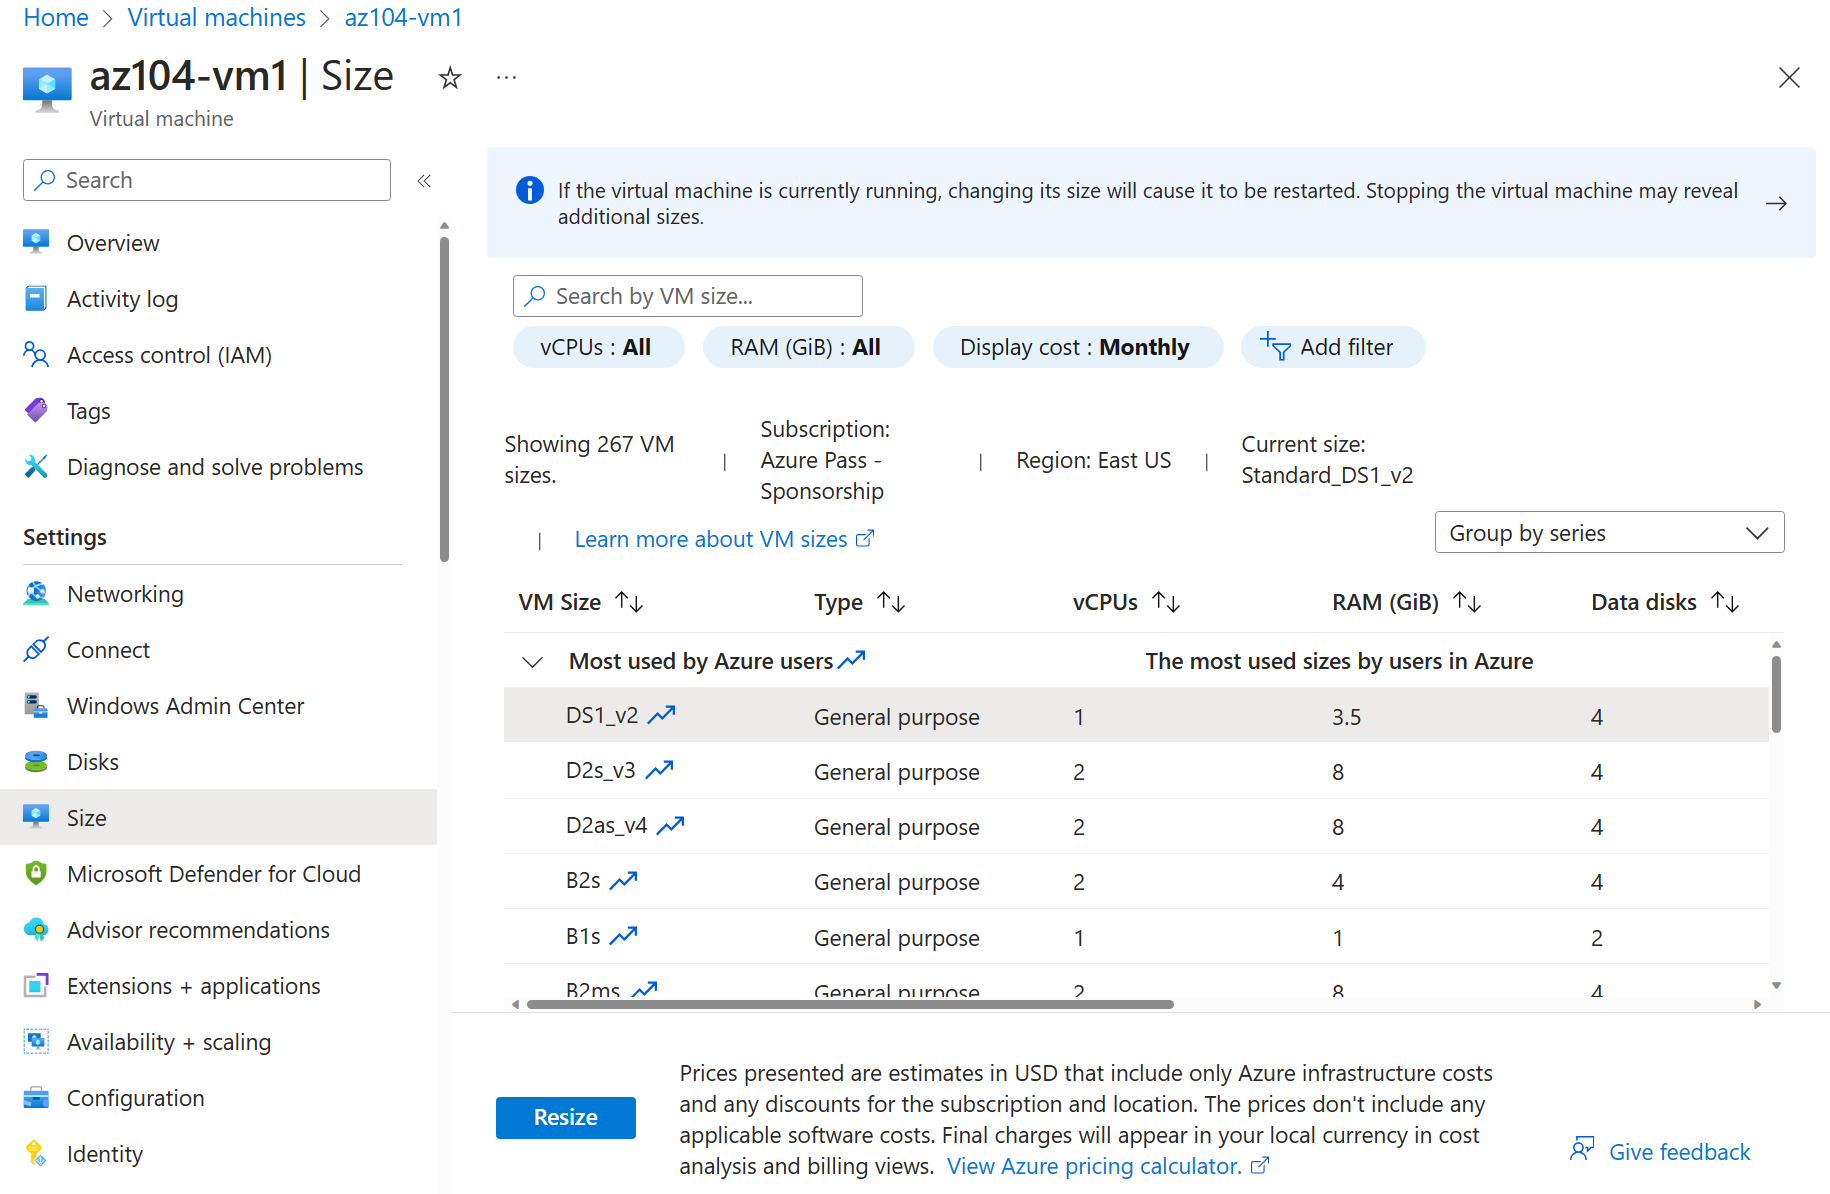
In the Availability + scale blade, select Size.
-
Set the virtual machine size to D2as_v4 size, and click Resize. If prompted, confirm the change.
If the VM size is not available, choose another larger VM. Resizing is also known as vertical scaling, up or down.
-
Navigate to the Alerts blade. Resizing the virtual machine should have triggered your VM2Changed alert rule. If needed, Refresh the page.
-
Select an alert and review the details. Edit the User response and ensure the status is Acknowledged. Save your changes.
- You should also receive an email notification that reads, Important notice: Azure Monitor alert VM was updated… If not, open your email program and look for an email from azure-noreply@microsoft.com.
Check your learning.
- In the portal, can you access and review virtual machine metrics and logs?
- Can you resize a virtual machine?
- Can you manage alerts? For example, acknowledge that an alert has been reviewed.
Skill 5: Configure an alert processing rule (optional)
In this task, you create an alert processing rule.
-
Continue in the Alerts blade, select Alert processing rules and then + Create.
Alert processing rules decide what happens when an alert is triggered. Alert processing rules can be used to suppress alert notification during maintenance periods.
-
Notice the alert scope is VM2.
-
Select Next: Rule settings, then select Suppress notifications.
-
Select Next: Scheduling.
-
Define a rule to suppress notifications during overnight maintenance.
Setting Value Apply the rule At a specific time Start Enter today’s date at 10 pm. End Enter tomorrow’s date at 7 am. Time zone Select the local time zone. -
Select Next: Details and enter these settings:
Setting Value Resource group RG1 Rule name Planned MaintenanceDescription Suppress notifications during testing. -
Select Review + create to validate your input, then select Create.
Check your learning.
- Can you configure an alert processing rule? For example, to suppress alerts during a maintenance period.
Learn more with self-paced training
- Monitor your Azure virtual machines with Azure Monitor. Monitor your Azure VMs by using Azure Monitor to collect and analyze VM host and client metrics and logs.
Key takeaways
Congratulations on completing the exercise. Here are the main takeaways:
- Alerts help you detect and address issues before users notice there might be a problem with your infrastructure or application.
- You can alert on any metric or log data in the Azure Monitor data platform.
- An alert rule monitors your data and captures a signal that indicates something is happening on the specified resource.
- An alert is triggered if the conditions of the alert rule are met. Several actions (email, SMS, push, voice) can be triggered.
- Action groups include individuals that should be notified of an alert.
- Alert processing rules decide what happens when an alert is triggered. Alert processing rules can be used to suppress alert notification during maintenance periods.