Create a paginated report
Overview
The estimated time to complete the lab is 45 minutes
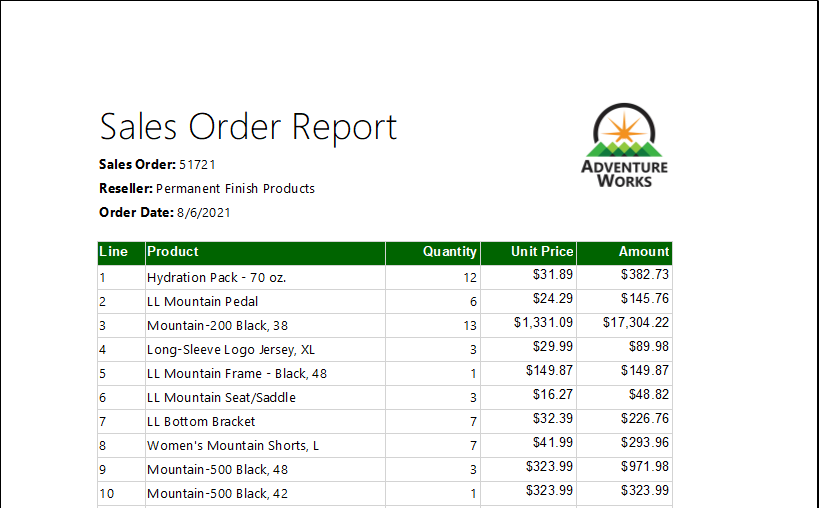
In this lab, you will use Power BI Report Builder to develop a pixel-perfect paginated report layout that sources data from the AdventureWorksDW2022-DP500 SQL Server database. You will then create a data source and dataset, and also configure a report parameter. The report layout will allow data to render over multiple pages and to be exported in PDF and other formats.
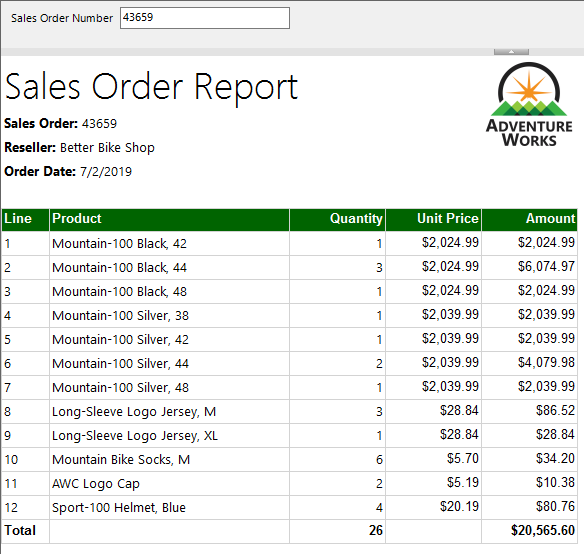
The final report will look like the following:
In this lab, you learn how to:
-
Use Power BI Report Builder
-
Design a multi-page report layout
-
Define a data source
-
Define a dataset
-
Create a report parameter
-
Export a report to PDF
Get started
In this exercise, you will open Power BI Report Builder to create and then save a report.
Clone the repository for this course
-
On the start menu, open the Command Prompt

-
In the command prompt window, navigate to the D drive by typing:
d:Press enter.

-
In the command prompt window, enter the following command to download the course files and save them to a folder called DP500.
git clone https://github.com/MicrosoftLearning/DP-500-Azure-Data-Analyst DP500 -
When the repository has been cloned, close the command prompt window.
-
Open the D drive in the file explorer to ensure the files have been downloaded.
Create the report
In this task, you will open Power BI Report Builder to create and then save a report.
-
To open Power BI Report Builder, on the taskbar, select the Power BI Report Builder shortcut.

-
If you are prompted to update to the latest version of Power BI report Builder, select Cancel.
-
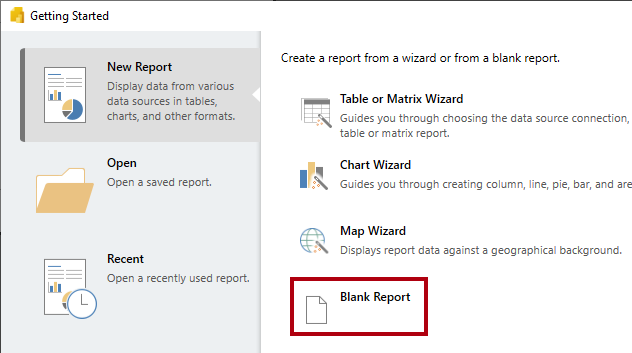
In the Power BI Report Builder window, to create a new report, in the Getting Started window, select Blank Report.
-
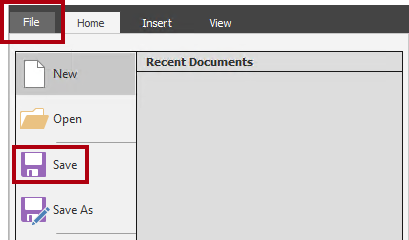
To save the report, select the File tab (located at the top-left), and then select Save.
-
In the Save As Report window, navigate to the D:\DP500\Allfiles\15\MySolution folder.
-
In the Name box, enter Sales Order Report.
-
Select Save.
Develop the report layout
In this exercise, you will develop the report layout, and then explore the final report design.
Configure the report header
In this task, you will configure the report header.
-
In the report designer, notice the default report layout, which consists of a body region and a report footer region.
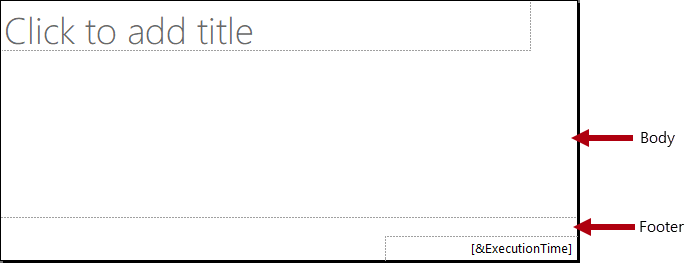
The body contains a single textbox ready for a report title, and the report footer contains a single textbox describing the report execution time.
The default design will render the report title once, in the body, on the first rendered page. However, you will now modify the report design by adding a report header region, and by moving the report title textbox into this region. This way, the report title will repeat on every page. You will also add an image of the company logo.
-
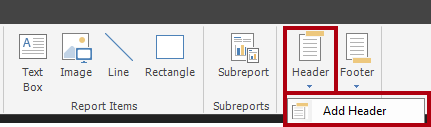
To add a report header region, on the Insert ribbon tab, from inside the Header & Footer group, open Header, and then select Add Header.
-
In the report designer, notice that a report header region has been added to the report layout.
-
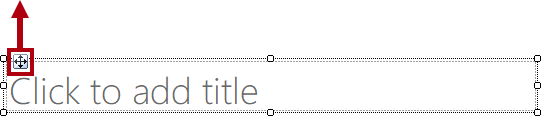
To select the body textbox, select the “Click to add title” textbox.
-
To move the textbox, select the four-headed arrow icon, and then drag it into the header region to then drop it at the very top-left of the report header region.
-
To modify the report title textbox text, select inside the text box, and then enter: Sales Order Report
To resize the textbox, you will first open the Properties pane. For fine-grained control of location and size properties, you will need use the Properties pane.
-
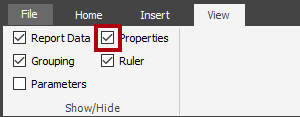
On the View ribbon tab, from inside the Show/Hide group, select Properties.
-
To focus on the report title textbox, first select an area outside the textbox, and then select the textbox again.
The textbox is selected when you see the border of the textbox highlighted and resizing handles (small circles) appear on the border.
-
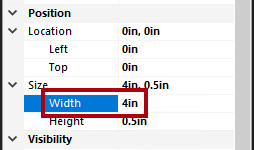
In the Properties pane (located at the right), scroll down the list to locate the Position group.
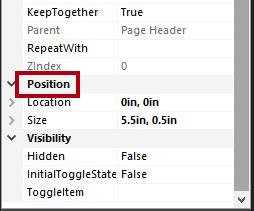
The Position group allows setting exact values for the location and size of report items.
Important: Enter the values as directed in this lab. Pixel-perfect layout is required to achieve the page rendering at the end of the lab.
-
Within the Position group, expand the Location group, and ensure that the Left and Top properties are each set to 0in.
The location and size units are in inches because the regional settings of the lab virtual machine is set to the United States. If your region uses metric measurements, centimeters would be the default unit.
-
Within the Position group, expand the Size group, and then set the Width property to 4.
-
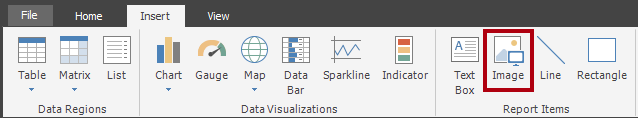
To insert an image, on the Insert ribbon tab, from inside the Report Items group, select Image.
-
To add the image to the report design, select the area inside the report header region, to the right of the report title textbox.
-
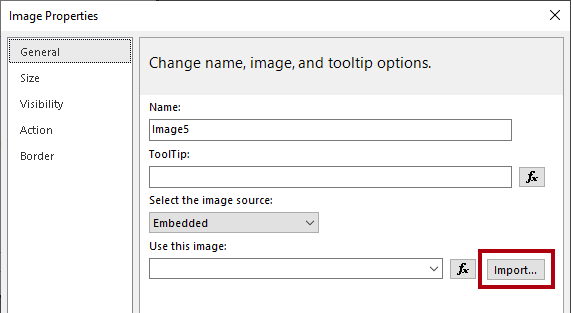
In the Image Properties window, to import from an image file, select Import.
-
In the Open window, navigate to the D:\DP500\Allfiles\15\Assets folder, and then select the AdventureWorksLogo.jpg file.
-
Select Open.
-
In the Image Properties window, select OK.
-
In the report designer, notice that the image was added, and is in focus.
-
To position and resize the image, in the Properties pane, configure the following properties:
Property Value Position > Location > Left 5 Position > Location > Top 0 Position > Size > Width 1 Position > Size > Height 1 -
To resize the report header region, first set focus to the region by selecting a blank area within it.
-
In the Properties pane, set the General > Height property to 1.
-
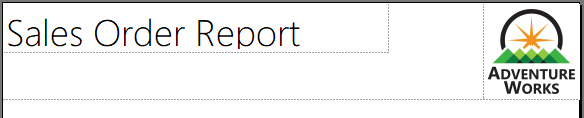
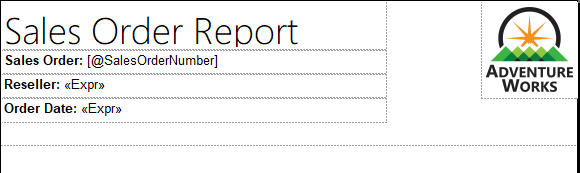
Verify that the report header region contains a single textbox and image, and looks like the following:
-
To save the report, on the File tab, select Save.
Tip: You can also select the disk icon located at the top-left.
You are now ready to configure the report to retrieve a database query result.
Retrieve data
In this task, you will create a data source and dataset to retrieve a query result from the AdventureWorksDW2022-DP500 SQL Server database.
-
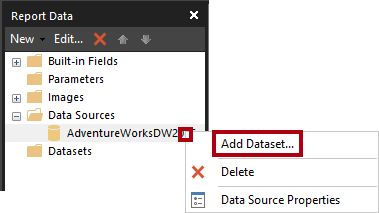
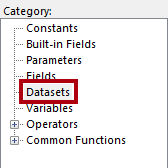
In the Report Data pane (located at the left), right-click the Data Sources folder, and then select Add Data Source.
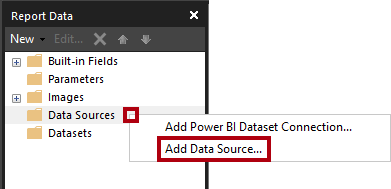
It’s possible to retrieve data from cloud or on-premises databases, or a Power BI dataset.
-
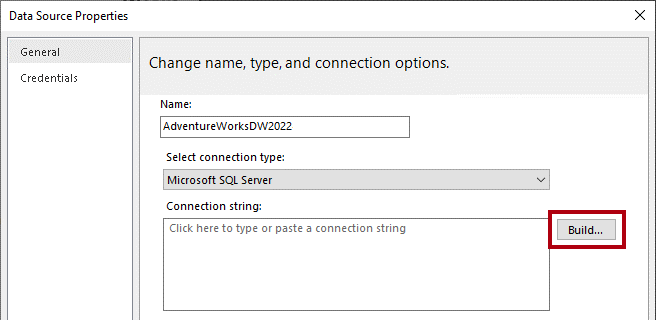
In the Data Source Properties window, in the Name box, replace the text with AdventureWorksDW2022.
-
In the Select Connection Type dropdown list, notice that Microsoft SQL Server is selected.
-
To build the connection string, select Build.
-
In the Connection Properties window, in the Server Name box, enter localhost.
In this lab, you will connect to the SQL Server database by using localhost. However, it’s not a recommended practice when creating your own solutions because gateway data sources cannot resolve localhost.
-
In the Select or Enter a Database Name dropdown list, select the AdventureWorksDW2022-DP500 database.
-
Select OK.
-
In the Data Source Properties window, select OK.
-
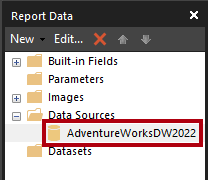
In the Report Data pane, notice the addition of the AdventureWorksDW2022 data source.
-
To create a dataset, in the Report Data pane, right-click the AdventureWorksDW2022 data source, and then select Add Dataset.
A report dataset is a different in purpose and structure from a Power BI dataset.
-
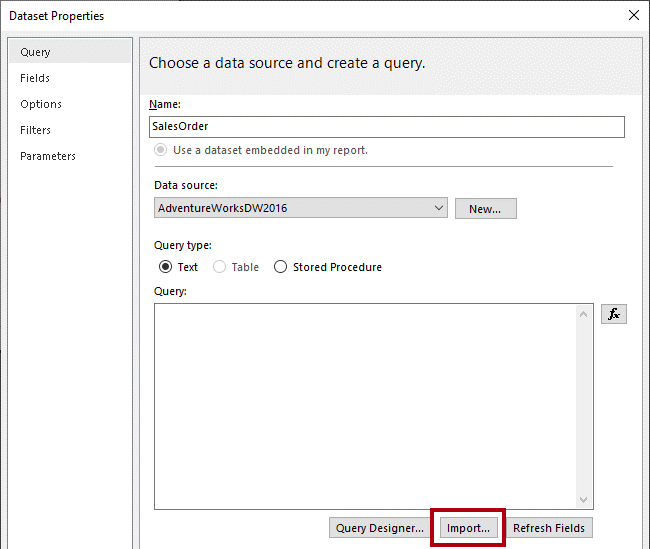
In the Dataset Properties window, in the Name box, replace the text with SalesOrder.
-
To import a pre-defined query, select Import.
-
In the Import Query window, navigate to the D:\DP500\Allfiles\15\Assets folder, and then select the SalesOrder.sql file.
-
Select Open.
-
In the Query box, review the query, and be sure to scroll down to the bottom of the query text.
It’s not important that you understand the details of the query statement. It has been designed to retrieve sales order line details. The WHERE clause includes a predicate to restrict the query result to a single sales order. The ORDER BY clause ensures the rows are returned by line number order.
-
Notice the use of @SalesOrderNumber in the WHERE clause, which represents a query parameter.
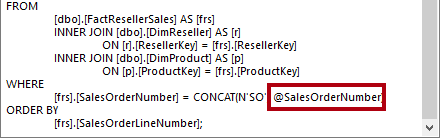
A query parameter is a placeholder for a value that will be passed in at query execution time. You will configure a report parameter to prompt the report user for a single sales order number which will then be passed to the query parameter.
-
Select OK.
-
In the Report Data pane, notice the addition of the SalesOrder dataset and its fields.
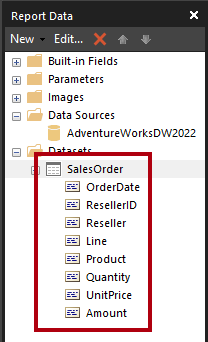
Fields are used to configure data regions in the report layout. They were derived from the dataset query columns.
-
Save the report.
Configure the report parameter
In this task, you will configure the report parameter with a default value.
-
In the Report Data pane, expand the Parameters folder to reveal the SalesOrderNumber report parameter.
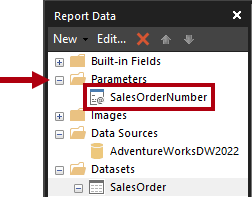
The SalesOrderNumber report parameter was added automatically when the dataset was created. It’s because the dataset query included the @SalesOrderNumber query parameter.
-
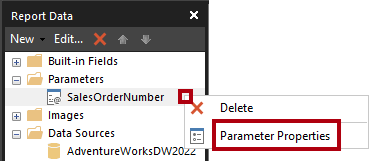
To edit the report parameter, right-click the SalesOrderNumber report parameter, and then select Parameter Properties.
-
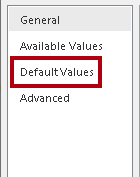
In the Report Parameter Properties window, at the left, select the Default Values pages.
-
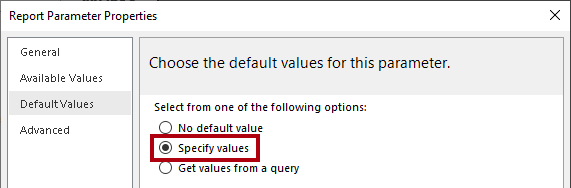
Select the Specify Values option.
-
To add a default value, select Add.
-
In the Value dropdown list, replace the text with 43659.
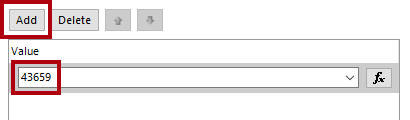
Sales order 43659 is the value you will initially use to test the report design.
-
Select OK.
-
Save the report.
You will now complete the report header region design by adding textboxes to describe the sales order.
Finalize the report header layout
In this task, you will finalize the report header region design by adding textboxes.
-
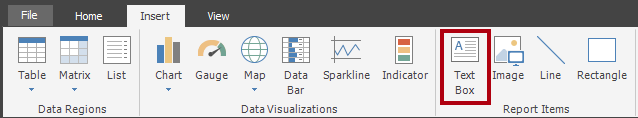
To add a textbox to the report header region, on the Insert ribbon tab, from inside the Report Items group, select Text Box.
-
Select inside the report header region, directly beneath the report title textbox.
-
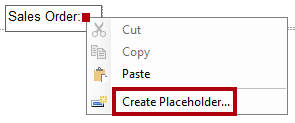
Inside the new textbox, enter Sales Order: followed by a space.
-
To insert a place holder, immediately after the space just entered, right-click and then select Create Placeholder.
-
In the Placeholder Properties window, at the right of the Value dropdown list, select the fx button.
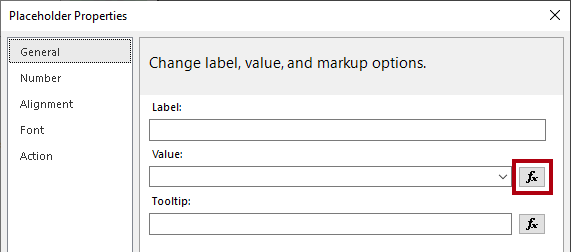
The fx button allows entering a custom expression. This expression will be used to return the sales order number.
-
In the Expression window, in the Category list, select Parameters.
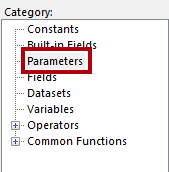
-
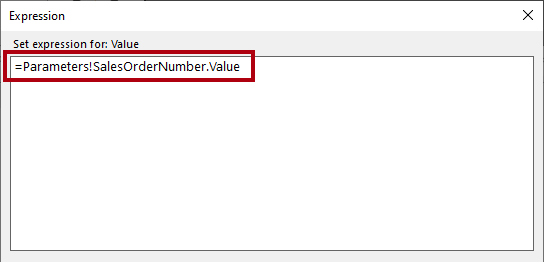
In the Values list, double-click the SalesOrderNumber parameter.
-
In the expression box, notice that a programmatic reference to the SalesOrderNumber report parameter was added.
-
Select OK.
-
In the Placeholder Properties window, select OK.
-
Select a blank area of the report header region, and then select the new textbox.
-
In the Properties pane, configure the following position properties:
Property Value Position > Location > Left 0 Position > Location > Top 0.5 Position > Size > Width 4 Position > Size > Height 0.25 -
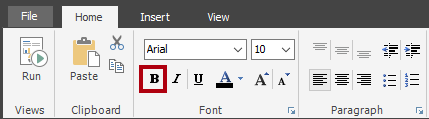
To format part of the textbox text, inside the new textbox, select only the Sales Order: text.
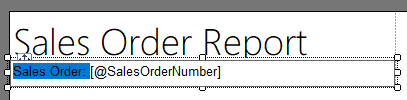
-
On the Home ribbon tab, from inside the Font group, select the Bold command.
-
Add another textbox to the report header region, and then enter the text Reseller: followed by a space.
Tip: You can also add a textbox by right-clicking the canvas, and then selected Insert > Text Box.
-
After the space, insert a placeholder, and then set the value of the placeholder to use an expression.
-
In the Expression window, in the Category list, select Datasets.
-
Base the expression value on First(Reseller) value.
-
In the Properties pane, configure the following position properties:
Property Value Position > Location > Left 0 Position > Location > Top 0.75 Position > Size > Width 4 Position > Size > Height 0.25 -
Format the Reseller: text as bold.
-
Add a third (and last) textbox to the report header region, and then enter the text Order Date: followed by a space.
-
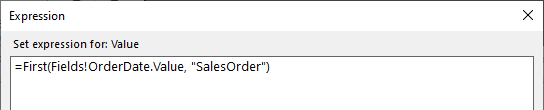
After the space, insert a placeholder, and set the value of the placeholder to use an expression based on the Datasets category, First(OrderDate) value.
-
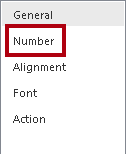
To format the date value, in the Placeholder Properties window, select the Number page.
-
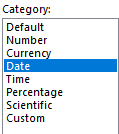
In the Category list, select Date.
-
In the Type list, select a suitable date format type.
-
In the Placeholder Properties window , select OK.
-
In the Properties pane, configure the following position properties:
Property Value Position > Location > Left 0 Position > Location > Top 1 Position > Size > Width 4 Position > Size > Height 0.25 -
Format the Order Date: text as bold.
-
Finally, select a blank area of the report header region.
-
In the Properties pane, set the Height property to 1.5.
-
Verify that the report header region looks like the following:
-
Save the report.
-
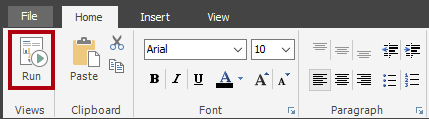
To preview the report, on the Home ribbon tab, from inside the Views group, select Run.

Running the report renders the report in HTML format. As the only report parameter has a default value, the report will run automatically.
-
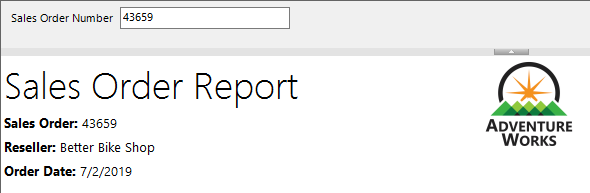
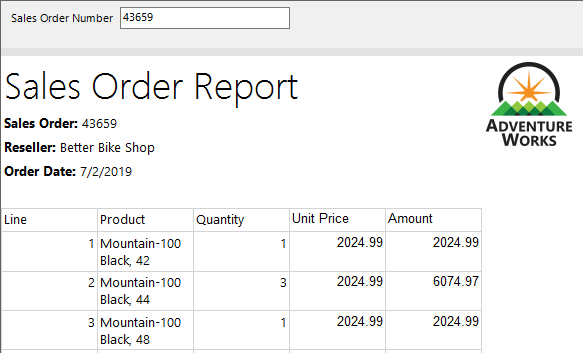
Verify that the rendered report looks like the following:
-
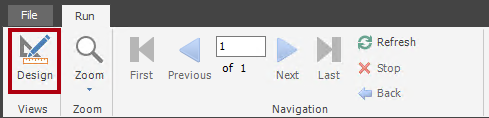
To return to design view, on the Run ribbon tab, from inside the Views group, select Design.
You will now add a table to the report body to display a formatted layout of the sales order lines.
Add a table data region
In this task, you will add a table data region to the report body.
-
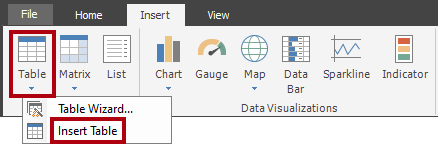
On the Insert ribbon tab, from inside the Data Regions group, open Table, and then select Insert Table.
-
To add the table, select a blank area inside the report body.
-
In the Properties pane, configure the following position properties:
Property Value Position > Location > Left 0 Position > Location > Top 0 The table will display five columns. By default, the table template includes only three columns.
-
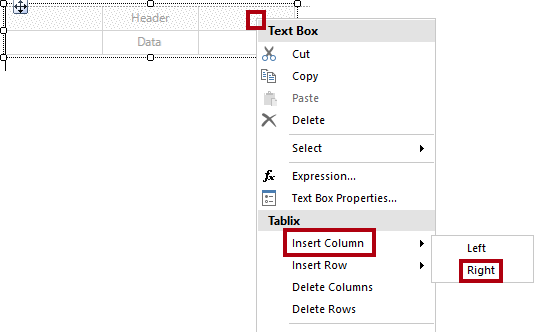
To add a column to the table, right-click inside any cell of the last column, and then select Insert Column > Right.
-
Repeat the last step to add a second new column.
-
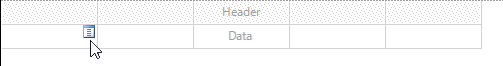
Hover the cursor over the cell in the second row of the first column to reveal the field picker icon.
-
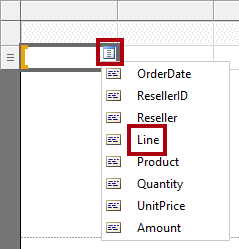
Select the field picker icon, and then select the Line field.
-
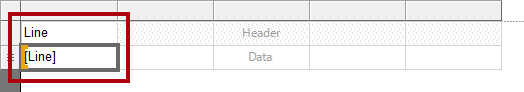
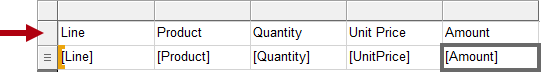
Notice that the table now includes a text value in the first row (header), and a field reference in the detail row.
-
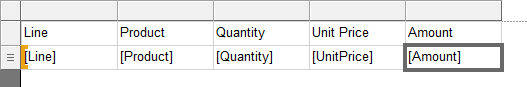
Add fields to the next four columns, in order, as follows:
-
Product
-
Quantity
-
UnitPrice
-
Amount
-
-
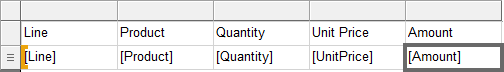
Verify that the table design looks like the following:
-
Save the report.
-
Preview the report.
The table includes a header and 12 sales order line rows. There are many improvements that can be made by formatting the table layout.
In the next task you will:
-
Format the table header by using a background color and bold font style
-
Modify column widths to remove redundant space and to prevent long text values from wrapping
-
Left-justify the first column values
-
Right-justify the last three column values
-
Format currency values using a currency symbol (for USD)
-
Add and format a total row for the table
-
Format the table data region
In this task, you will format the table data region.
-
Return to design view.
-
Select any cell in the table to reveal the gray cell guides (located across the top and at the left side of the data region).
The cell guides are there to help you configure entire rows or columns.
-
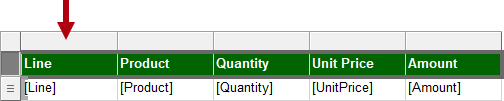
To format the table header, select the header row guide.
Selecting a row or a column guide selects all cells in the row or column. Each cell is in fact a textbox. Formatting single textbox-or a multi-selection of textboxes-can then be achieved by using the Properties pane, or the ribbon commands.
-
In the Properties pane (or the ribbon), configure the following properties:
Property Value Fill > BackgroundColor DarkGreen (tip: hover the cursor over each color to reveal its name) Font > Color White Font > Font > FontWeight Bold -
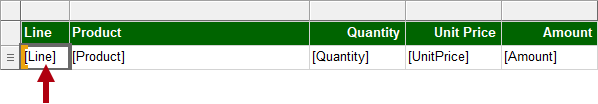
Select the first column guide.
-
In the Properties pane, set the Position > Size > Width property to 0.5.
-
Set the width of the second column to 2.5.
-
Select the Quantity column guide, and then while pressing the Ctrl key, select also the last two column header guides (Unit Price and Amount).
-
In the Properties pane (or ribbon), set the Alignment > TextAlign property to Right.
-
Set the Line detail textbox to left align.
-
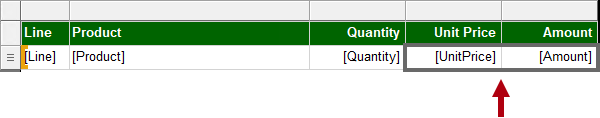
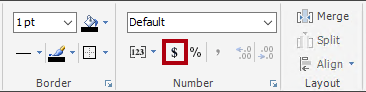
On the Home ribbon tab, from inside the Number group, set the last two detail (not header) textboxes (UnitPrice and Amount) to format with a currency symbol.
-
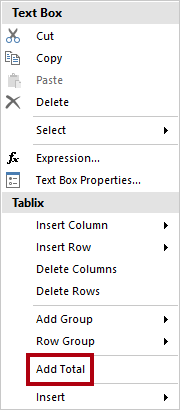
To add a total row to the table, right-click the Quantity detail textbox, and then select Add Total.
-
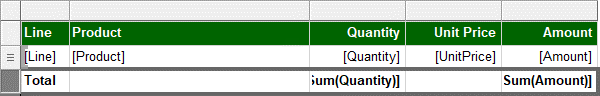
Notice that a new row, which represents the table footer, has been added, and that the expression will evaluate the sum of Quantity values.
-
Repeat the last step to add a total for the Amount detail textbox.
-
In the first cell of the table footer row, enter the word Total.
-
Format all textboxes in the footer row to format as bold.
-
Verify that the table design looks like the following:
-
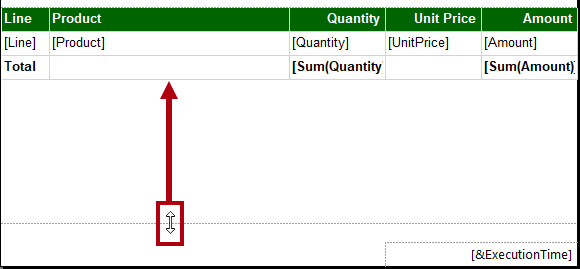
To remove any trailing space after the table, hover the cursor over the dashed line between the report body and report footer region, and then drag upwards to touch the bottom of the table.
-
Save the report
-
Preview the report.
-
Verify that the rendered report looks like the following:
-
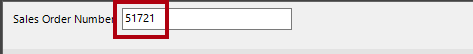
In the Sales Order Number parameter box, replace the value with 51721.
-
To re-run the report, at the right, select View Report.
This sales order has 72 sales order lines, and so the data will render over many pages.
-
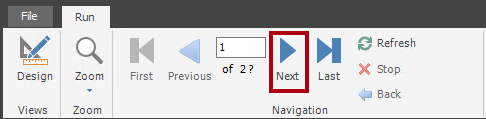
To navigate to the second page of the report, on the Run ribbon tab, from inside the Navigation group, select Next.
-
On page 2, notice that the table header does not appear.
You will address this issue in the next task.
-
Scroll to the bottom of the page, and then notice that the report footer displays only the execution time.
In the next task, you will improve the footer text by appending the page number.
Finalize the report design
In this task, you will finalize the report design by ensuring multi-page reports render appropriately.
-
Switch to the design view.
-
To ensure the table header repeats on all pages, first select any textbox of the table.
-
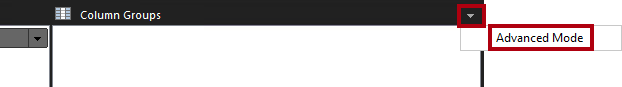
In the Grouping pane (located along the bottom of the report designer), at the far right of the Column Groups, select the down-arrow, and then select Advanced Mode.
-
In the Row Groups section, select the first static group.
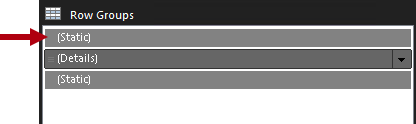
This selected the table header row.
-
In the Properties pane, set the Other > RepeatOnNewPage property to True.
This ensures that the first static group (representing the table header) will repeat on all pages.
-
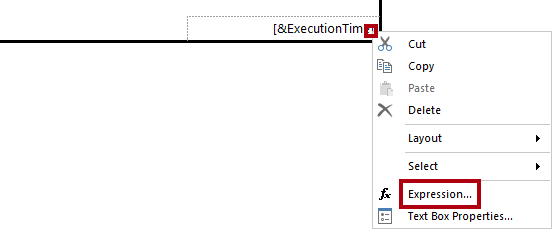
In the table footer region, right-click the ExecutionTime textbox, and then select Expression.
-
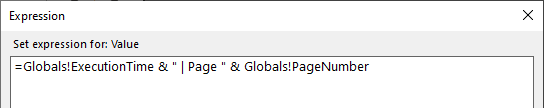
In the Expression window, in the expression box, append a space, followed by **& “ Page “ &**, to produce the following expression: =Globals!ExecutionTime & " | Page " & -
Ensure that a space follows the last ampersand (&).
-
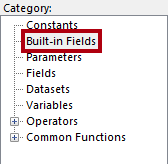
In the Category list, select Built-in Fields.
-
To inject the page number value into the expression, in the Item list, double-click PageNumber.
-
Verify that the complete expression reads as follows:
-
Select OK.
-
Drag the left side of the textbox to increase the width to the width of the report page.

The design of the report is now complete. Lastly, you will ensure that the page width is set to exactly six inches, and also remove the report parameter default value.
-
To select the report body, right-click any table textbox, and then select Select > Body.
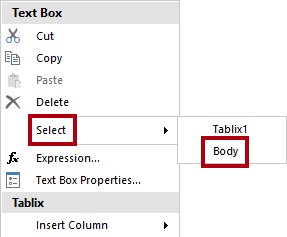
As the table fills the entire report body, this technique must be used to select the report body.
-
In the Properties pane, ensure that the Position > Size > Width property is set to 6.
It’s important the width is not greater than six inches, as rendering to print format would break the table up across multiple pages.
-
In the Report Data pane, open the SalesOrderNumber report parameter properties.
-
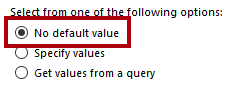
On the Default Values page, select the No Default Value option.
-
Select OK.
- Save the report.
Explore the completed report
In this task, you will view the report in print layout mode.
-
Preview the report.
-
In the Sales Order Number parameter box, enter the value with 51721
-
On the Run ribbon tab, from inside the Print group, select Print Layout.
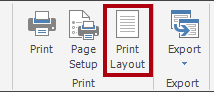
Print layout mode provides a preview of what the report will look like when printed to the strict page size.
-
Navigate to pages 2 and 3.
In this lab, you won’t publish the report. Note that paginated reports can only be rendered in the Power BI service when they are stored in a workspace that has its license mode set to Premium per user or Premium per capacity, and when that capacity has the paginated reports workload enabled.