Use tools to optimize Power BI performance
Overview
The estimated time to complete the lab is 30 minutes
In this lab, you will learn how to use two external tools to help you develop, manage, and optimize data models and DAX queries.
In this lab, you learn how to:
-
Use Best Practice Analyzer (BPA).
-
Use DAX Studio.
Get started
Clone the repository for this course
-
On the start menu, open the Command Prompt

-
In the command prompt window, navigate to the D drive by typing:
d:Press enter.

-
In the command prompt window, enter the following command to download the course files and save them to a folder called DP500.
git clone https://github.com/MicrosoftLearning/DP-500-Azure-Data-Analyst DP500 -
When the repository has been cloned, close the command prompt window.
-
Open the D drive in the file explorer to ensure the files have been downloaded.
Use Best Practice Analyzer
In this exercise, you will install Tabular Editor 2 and load Best Practice Analyzer (BPA) rules. You will review the BPA rules, and then address specific issues found in the data model.
BPA is a free third-party tool that notifies you of potential modeling missteps or changes that you can make to improve your model design and performance. It includes recommendations for naming, user experience, and common optimizations that you can apply to improve performance. For more information, see Best practice rules to improve your model’s performance.
Download and Install Tabular Editor 2
Download and install Tabular Editor 2 to enable the creation of calculation groups.
Important: If you have already installed Tabular Editor 2 in your VM environment, continue to the next task.
Tabular Editor is an alternative tool for authoring tabular models for Analysis Services and Power BI. Tabular Editor 2 is an open source project that can edit a BIM file without accessing any data in the model.
-
Ensure Power BI Desktop is closed.
-
In Microsoft Edge, navigate to the Tabular Editor Release page.
https://github.com/TabularEditor/TabularEditor/releases -
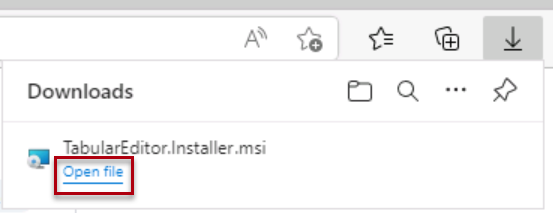
Scroll down to the Assets section and select the TabularEditor.Installer.msi file. This will initiate the file install.
-
Upon completion, select Open file to run the installer.
-
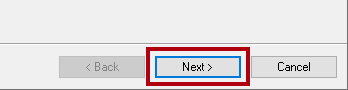
In the Tabular Editor installer window, select Next.
-
At the License Agreement step, if you agree, select I agree, and then select Next.
-
At the Select Installation Folder step, select Next.
-
At the Application Shortcuts step, select Next.
-
At the Confirm Installation step, select Next.
If prompted, select Yes to allow app to make changes.
-
When the installation is complete, select Close.
Tabular Editor is now installed and registered as a Power BI Desktop external tool.
Set up Power BI Desktop
In this task, you will open a pre-developed Power BI Desktop solution.
-
In File Explorer, go to the D:\DP500\Allfiles\13\Starter folder.
-
To open a pre-developed Power BI Desktop file, double-click the Sales Analysis - Use tools to optimize Power BI performance.pbix file.
-
To save the file, on the File ribbon tab, select Save as.
-
In the Save As window, go to the D:\DP500\Allfiles\13\MySolution folder.
-
Select Save.
-
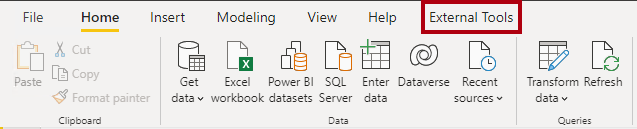
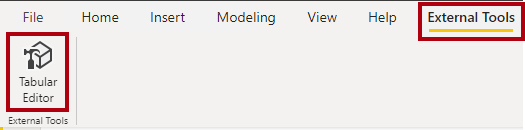
Select the External Tools ribbon tab.
-
Notice that you can launch Tabular Editor from this ribbon tab.

Later in this exercise, you will use Tabular Editor to work with BPA.
Review the data model
In this task, you will review the data model.
-
In Power BI Desktop, at the left, switch to Model view.

-
Use the model diagram to review the model design.
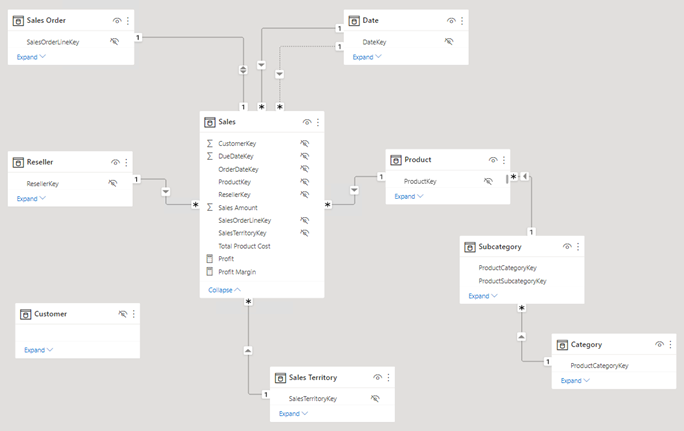
The model comprises eight dimension tables and one fact table. The Sales fact table stores sales order details. It’s a classic star schema design that includes snowflake dimension tables (Category > Subcategory > Product) for the product dimension.
In this exercise, you will use BPA to detect model issues and fix them.
Load BPA rules
In this task, you will load BPA rules.
The BPA rules aren’t added during the Tabular Editor installation. You must download and install them.
-
On the External Tools ribbon, select Tabular Editor.
Tabular Editor opens in a new window and connects live to the data model hosted in Power BI Desktop. Changes made to the model in Tabular Editor aren’t propagated to Power BI Desktop until you save them.
-
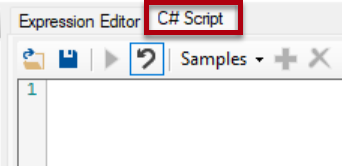
To load the BPA rules, select the C# Script tab.
Note: This may be called the Advanced Scripting tab in older versions of Tabular Editor.
-
Paste in the following script.
Tip: The script is available to copy and paste from the D:\DP500\Allfiles\13\Assets\Snippets.txt.
System.Net.WebClient w = new System.Net.WebClient(); string path = System.Environment.GetFolderPath(System.Environment.SpecialFolder.LocalApplicationData); string url = "https://raw.githubusercontent.com/microsoft/Analysis-Services/master/BestPracticeRules/BPARules.json"; string downloadLoc = path+@"\TabularEditor\BPARules.json"; w.DownloadFile(url, downloadLoc); -
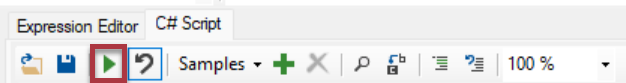
To run the script, on the toolbar, select the Run script command.
To use the BPA rules, you must close and then reopen Tabular Editor.
-
Close Tabular Editor.
-
To reopen Tabular Editor, in Power BI Desktop, on the External Tools ribbon, select Tabular Editor.

Review the BPA rules
In this task, you will review the BPA rules that you loaded in the previous task.
-
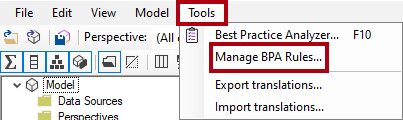
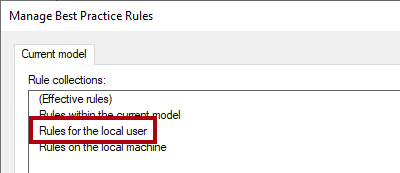
In Tabular Editor, on the menu, select Tools > Manage BPA Rules.
-
In the Manage Best Practice Rules window, in the Rule collections list, select Rules for the local user.
-
In the Rules in collection list, scroll down the list of rules.
Tip: You can drag the bottom right corner to enlarge the window.
Within seconds, Tabular Editor can scan your entire model against each of the rules and provides a report of all the model objects which satisfy the condition in each rule.
-
Notice that BPA groups the rules into categories.
Some rules, like DAX expressions, focus on performance optimization while others, like the formatting rules, are aesthetic-oriented.
-
Notice the Severity column.
The higher the number, the more important the rule.
-
Scroll to the bottom of the list, and then uncheck the Set IsAvailableInMdx to false on non-attribute columns rule.
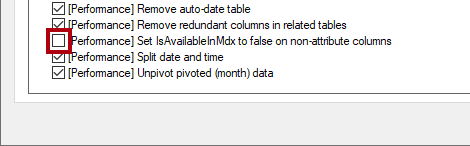
You can disable individual rules or entire categories of rules. BPA won’t check disabled rules against your model. The removal of this specific rule is to show you how to disable a rule.
-
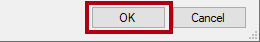
Select OK.
Address BPA issues
In this task, you will open BPA and review the results of the checks.
-
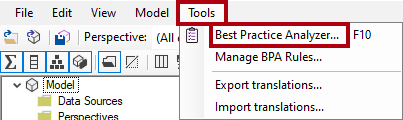
On the menu, select Tools > Best Practice Analyzer (or press F10).
-
In the Best Practice Analyzer window, if necessary, maximize the window.
-
Notice the list of (possible) issues, grouped by category.
-
In the first category, right-click the ‘Product’ table, and then select Ignore item.
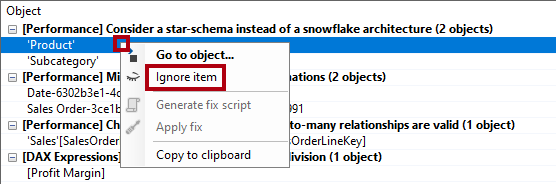
When an issue isn’t really an issue, you can ignore that item. You can always reveal ignored items by using the Show ignored command on the toolbar.
-
Further down the list, in the Use the DIVIDE function for division category, right-click [Profit Margin], and then select Go to object.
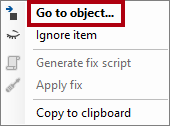
This command switches to Tabular Editor and focuses on the object. It makes it easy to apply a fix to the issue.
-
In the Expression Editor, modify the DAX formula to use the more efficient (and safe) DIVIDE function, as follows.
Tip: All formulas are available to copy and paste from the D:\DP500\Allfiles\13\Assets\Snippets.txt.
DIVIDE ( [Profit], SUM ( 'Sales'[Sales Amount] ) ) -
To save the model changes, on the toolbar, select the Save changes to the connected database command (or press Ctrl+S).
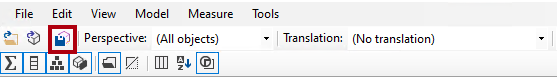
Saving changes pushes modifications to the Power BI Desktop data model.
-
Switch back to the (out of focus) Best Practice Analyzer window.
-
Notice that BPA no longer lists the issue.
-
Scroll down the list of issues to locate the Provide format string for “Date” columns category.

-
Right-click the ‘Date’[Date] issue, and then select Generate fix script.
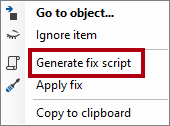
This command generates a C# script and copies it to the clipboard. You can also use the Apply fix command to generate and run the script, however it might be safer to review (and modify) the script before you run it.
-
When notified that BPA has copied the fix script to the clipboard, select OK.
-
Switch to Tabular Editor, and select the C# Script tab.
Note: This may be called the Advanced Scripting tab in older versions of Tabular editor.
-
To paste the fix script, right-click inside the pane, and then press Ctrl+V.
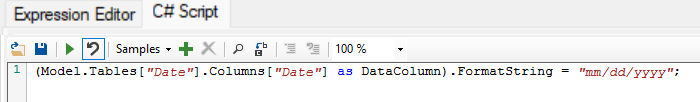
You can choose to make a change to the format string.
-
To run the script, on the toolbar, select the Run script command.
-
Save the model changes.
-
To close Tabular Editor, on the menu, select File > Exit.
-
Save the Power BI Desktop file.

You must also save the Power BI Desktop file to ensure the Tabular Editor changes are saved.
Use DAX Studio
Download and install DAX Studio.
According to its website, DAX Studio is “the ultimate tool for executing and analyzing DAX queries against Microsoft Tabular models.” It’s a feature-rich tool for DAX authoring, diagnosis, performance tuning, and analysis. Features include object browsing, integrated tracing, query execution breakdowns with detailed statistics, DAX syntax highlighting and formatting.
Download DAX Studio
In this task, you will download DAX Studio.
Download and install DAX studio to optimize DAX queries.
-
In Microsoft Edge, navigate to the DAX Studio downloads page.
https://daxstudio.org/downloads/ -
Select DAX Studio v.2.x.x (installer) - this will initiate the file install. note: The version of DAX studio will change slightly over time. Download the latest release.
-
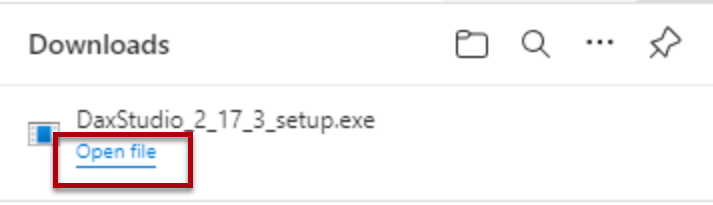
Upon completion, select Open file to run the installer.
-
In the DAX Studio installer window, select Install for all users (recommended).
-
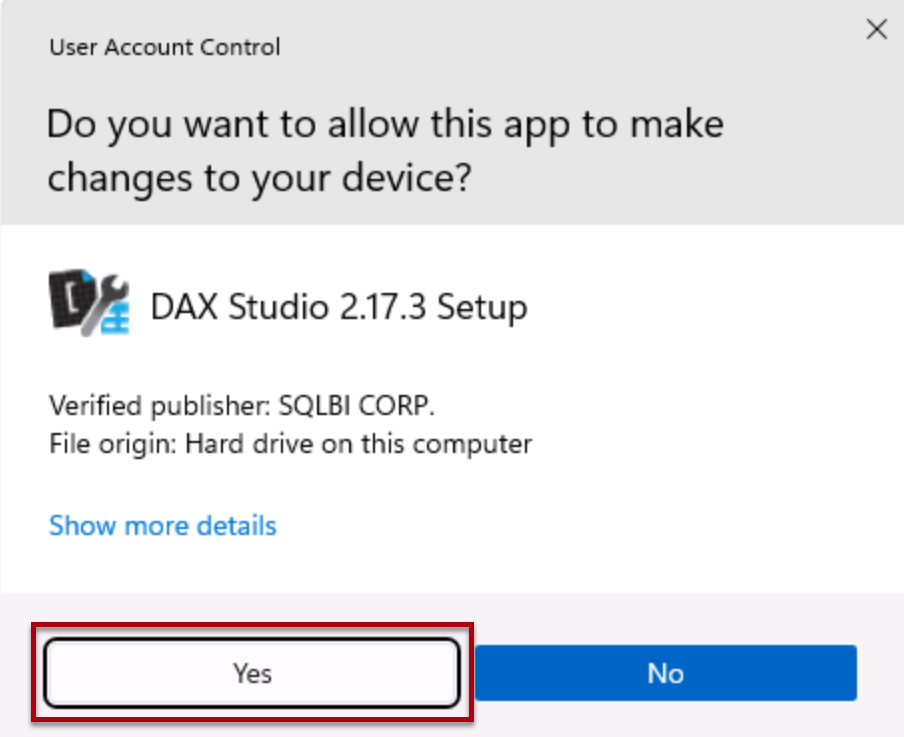
In the User Account Control window, select Yes to allow the app to make changes to the device.
-
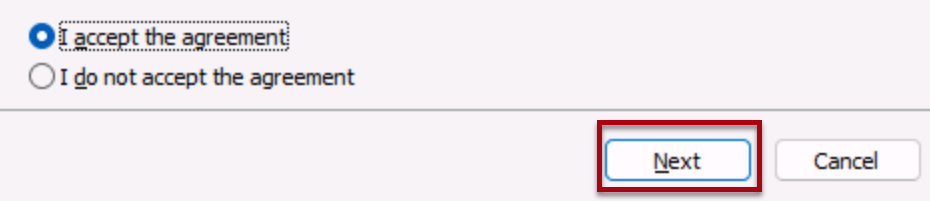
At the License Agreement step, if you accept the license terms, select I accept the agreement, and then select Next.
- Select Next to use the default destination location.
- Select Next to select the default components to install.
- Select Next to place the shortcut on the default start menu folder.
-
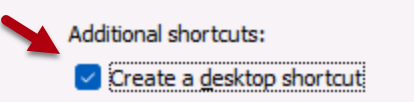
Select Create a desktop shortcut and select next.
-
Select Install.
-
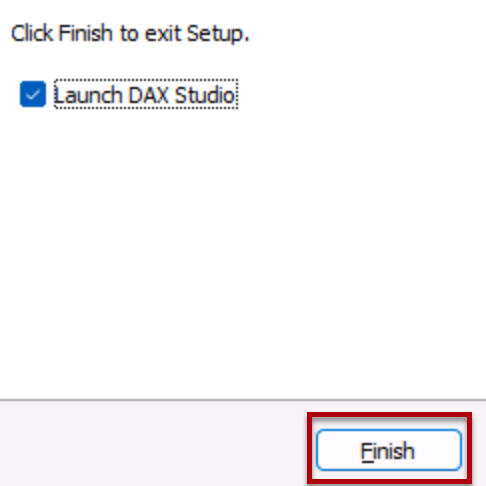
Upon completion, with Launch DAX Studio selected, select Finish. This will open DAX Studio.
-
In the Connect window, select the PBI / SSDT Model option.
-
In the corresponding dropdown list, ensure the Sales Analysis - Use tools to optimize Power BI performance model is selected.
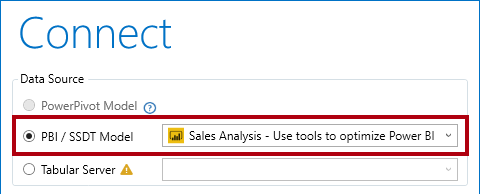
If you do not have the Sales Analysis - Use tools to optimize Power BI performance starter file open, you will not be able to connect. Be sure the file is open.
-
Select Connect.
- If necessary, maximize the DAX Studio window.
Use DAX studio to optimize a query
In this task, you will optimize a query by using an improved measure formula.
Note that it’s difficult to optimize a query when the data model volumes are small. This exercise focuses on using DAX Studio rather than optimizing DAX queries.
-
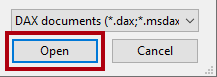
On the File menu, select Browse.
-
In the Open window, go to the D:\DP500\Allfiles\13\Assets folder.
-
Select Monthly Profit Growth.dax.
-
Select Open.
-
Read the comments at the top of the file, and then review the query that follows.
It’s not important to understand the query in its entirety.
The query defines two measures that determine monthly profit growth. Currently, the query only uses the first measure (at line 72). When a measure isn’t used, it doesn’t impact on the query execution.
-
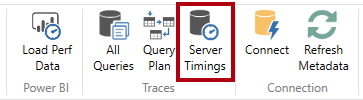
To run a server trace to record detailed timing information for performance profiling, on the Home ribbon tab, from inside the Traces group, select Server Timings.
-
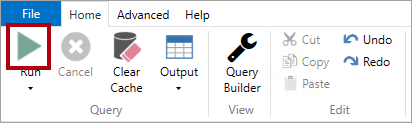
To run the script, on the Home ribbon tab, from inside the Query group, select the Run icon.
-
In the lower pane, review the query result.
The last column displays the measure results.
-
In the lower pane, select the Server Timings tab.

-
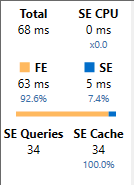
Review the statistics available at the left side.
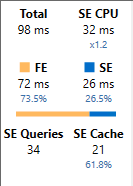
From top left to bottom right, the statistics tell you how many milliseconds it took to run the query, and the duration the storage engine (SE) CPU took. In this case (your results will differ), the formula engine (FE) took 73.5% of the time, while the SE took the remaining 26.5% of the time. There were 34 individual SE queries and 21 cache hits.
-
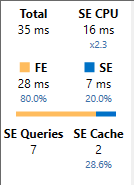
Run the query again, and notice that all SE queries come from the SE cache.
That’s because the results were cached for reuse. Sometimes in your testing, you may want to clear the cache. In that case, on the Home ribbon tab, by selecting the down arrow for the Run command.
The second measure definition provides a more efficient result. You will now update the query to use the second measure.
-
At line 72, replace the word Bad with Better.

-
Run the query, and then review the server timing statistics.
-
Run it a second time to result in full cache hits.
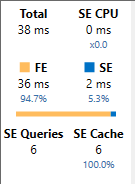
In this case, you can determine that the “better” query, which uses variables and a time intelligence function, performs better-almost a 50% reduction in query execution time.
Finish up
In this task, you will finish up.
-
To close DAX Studio, on the File ribbon tab, select Exit.
-
Close Power BI Desktop.