Create calculation groups
Overview
The estimated time to complete the lab is 45 minutes
In this lab, you will use Power BI Desktop and Tabular Editor 2 to create calculation groups.
In this lab, you learn how to:
- Create calculation groups.
- Format calculation items.
- Set calculation group precedence.
- Configure visuals to use calculation groups.
Get started
Clone the repository for this course
-
On the start menu, open the Command Prompt

-
In the command prompt window, navigate to the D drive by typing:
d:Press enter.

-
In the command prompt window, enter the following command to download the course files and save them to a folder called DP500.
git clone https://github.com/MicrosoftLearning/DP-500-Azure-Data-Analyst DP500 -
When the repository has been cloned, close the command prompt window.
-
Open the D drive in the file explorer to ensure the files have been downloaded.
Prepare your environment
Prepare your lab environment by installing Tabular Editor 2, setting up Power BI desktop, reviewing the data model, and creating measures.
Download and Install Tabular Editor 2
Download and install Tabular Editor 2 to enable the creation of calculation groups.
Important: If you have already installed Tabular Editor 2 in your VM environment, continue to the next task.
Tabular Editor is an editor alternative tool for authoring tabular models for Analysis Services and Power BI. Tabular Editor 2 is an open source project that can edit a BIM file without accessing any data in the model.
-
Ensure Power BI Desktop is closed.
-
In Microsoft Edge, navigate to the Tabular Editor Release page.
https://github.com/TabularEditor/TabularEditor/releases -
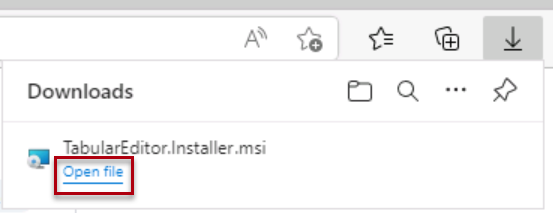
Scroll down to the Assets section and select the TabularEditor.Installer.msi file. This will initiate the file install.
-
Upon completion, select Open file to run the installer.
-
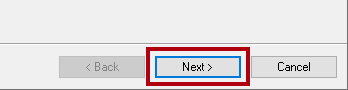
In the Tabular Editor installer window, select Next.
-
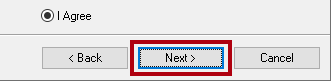
At the License Agreement step, if you agree, select I agree, and then select Next.
-
At the Select Installation Folder step, select Next.
-
At the Application Shortcuts step, select Next.
-
At the Confirm Installation step, select Next.
-
If you get a User Account Control popup window, select Yes.
-
When the installation is complete, select Close.
Tabular Editor is now installed and registered as a Power BI Desktop external tool.
Set up Power BI Desktop
Now you’ll open a pre-developed Power BI Desktop solution.
-
In File Explorer, go to the D:\DP500\Allfiles\07\Starter folder.
-
To open a pre-developed Power BI Desktop file, double-click the Sales Analysis - Create calculation groups.pbix file.
-
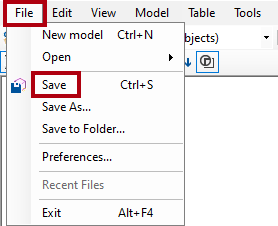
To save the file, on the File ribbon tab, select Save as.
-
In the Save As window, go to the D:\DP500\Allfiles\07\MySolution folder.
-
Select Save.
-
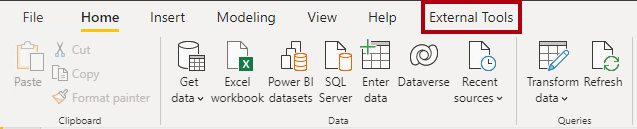
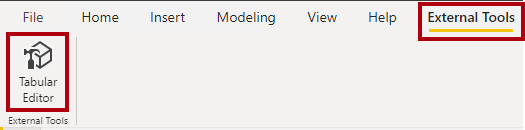
Select the External Tools ribbon tab.
-
Notice that you can launch Tabular Editor from this ribbon tab.

In the next exercise, you will use Tabular Editor to create calculation groups.
Review the data model
Review the data model to understand how calculation groups will apply to this model.
-
In Power BI Desktop, at the left, switch to Model view.
-
Use the model diagram to review the model design.
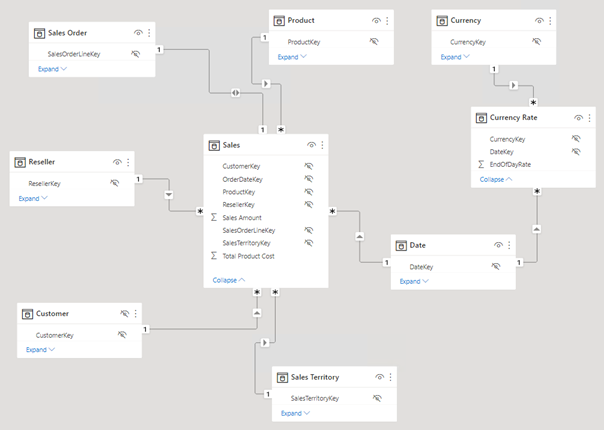
The model comprises seven dimension tables and two fact tables. The Sales fact table stores sales order details. The Currency Rate fact table stores daily currency exchange rates for multiple currencies. It’s a classic star schema design.
-
Switch to Report view.

-
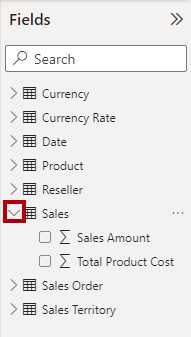
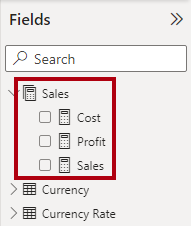
In the Data pane (located at the right), expand the Sales table to review the fields.
-
Notice that the two Sales table fields are decorated with the sigma symbol (∑).
The sigma symbol indicates that the fields will automatically summarize by using aggregation functions like sum, count, average, or others.
However, when calculation groups are added to a model, this automatic behavior must be disabled. That means that summarization can only be achieved by measures, which are defined by using Data Analysis Expressions (DAX) formulas. In the next task, you will add measures to the model.
Create measures
Create three sales-related measures in preparation for the creation of your calculation groups.
-
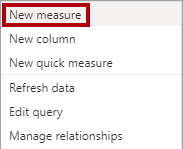
In the Data pane, right-click the Sales table, and then select New measure.
-
In the formula bar (located beneath the ribbon), replace the text with the following measure definition, and then press Enter.
Tip: All formulas are available to copy and paste from the D:\DP500\Allfiles\07\Assets\Snippets.txt.
DAX
Sales = SUM ( 'Sales'[Sales Amount] ) -
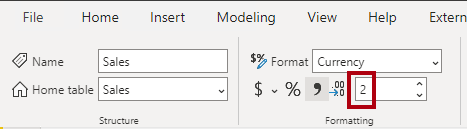
On the Measure tools contextual ribbon, from inside the Formatting group, set the decimals places to 2.
-
Create and similarly format a second measure named Cost by using the following definition:
DAX
Cost = SUM ( 'Sales'[Total Product Cost] ) -
Create and similarly format a third measure named Profit by using the following definition:
DAX
Profit = [Sales] - [Cost] -
In the Data pane, right-click the Sales Amount field, and then select Hide.
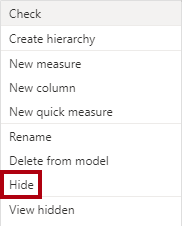
-
Also hide the Total Product Cost field.
-
Notice that the Sales table is now listed first in the Data pane, and it is decorated with a multi-calculator icon.
When a table comprises only visible measures, it’s presented at the top of the pane. This way, it behaves like a measure group (an object of a multidimensional model). Do not confuse this cosmetic representation of a tabular model with DAX calculation groups.
Create a calculation group
Now you’ll create two calculation groups. The first will support time intelligence. The second will support currency conversion.
Create the Time Intelligence calculation group
Use Tabular Editor to create the Time Intelligence calculation group. It will simplify the creation of many time-related calculations, including PY (prior year), YoY (year-over-year), and YoY % (year-over-year percentage). The calculation group will allow analyzing any measure by using different Time Intelligence calculations.
Power BI Desktop does not support the creation or management of calculation groups.
Tip: All syntax is available to copy and paste from the D:\DP500\Allfiles\07\Assets\Snippets.txt.
-
On the External Tools ribbon, select Tabular Editor.
Tabular Editor opens in a new window and connects live to the data model hosted in Power BI Desktop. Changes made to the model in Tabular Editor aren’t propagated to Power BI Desktop until you save them.
-
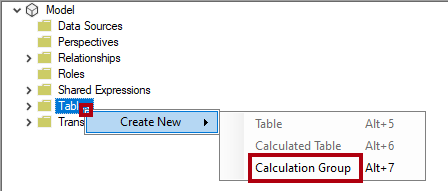
In the Tabular Editor window, in the left pane, right-click the Tables folder, and then select Create New > Calculation Group.
-
In the left pane, replace the default name with Time Intelligence, and then press Enter.
-
Expand open the Time Intelligence table.
-
Select the Name column.
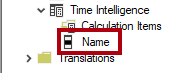
The calculation group comprises this single column, while rows of data define the group of calculations. It’s a good practice to rename the column to reflect the subject of the calculations.
-
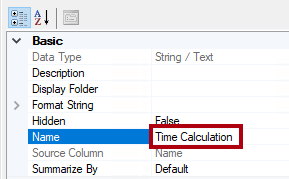
In the Properties pane (located at the bottom-right), select the Name property, and rename as Time Calculation.
-
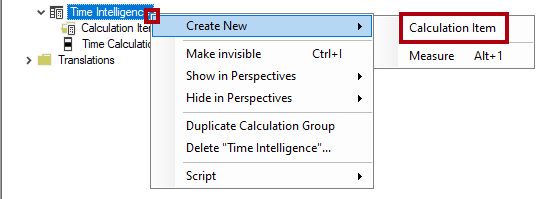
To create a calculation item, right-click the Time Intelligence table, and then select Create New > Calculation Item.
-
In the left pane, replace the default name with Current, and then press Enter.
-
In the Expression Editor pane (located above the Properties pane), enter the following formula:
DAX
SELECTEDMEASURE ()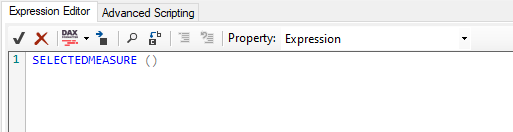
The SELECTEDMEASURE function returns a reference to the measure that is currently in context when the calculation item is evaluated.
-
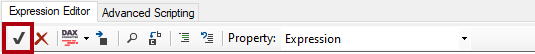
In the Expression Editor pane toolbar, select the first button to accept changes.
-
Create a second calculation item named PY by using the following formula:
DAX
CALCULATE ( SELECTEDMEASURE (), SAMEPERIODLASTYEAR ( 'Date'[Date] ) )The prior year (PY) formula calculates the value for the selected measure in the prior year.
-
Create a third calculation item named YoY by using the following formula:
DAX
SELECTEDMEASURE ()
    - CALCULATE ( SELECTEDMEASURE (), 'Time Intelligence'[Time Calculation] = "PY" )
The year-over-year (YoY) formula calculates the difference of the selected measure of the current year to the prior year.
-
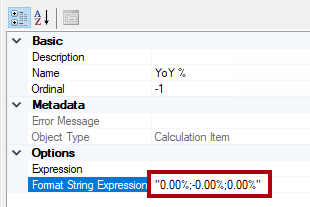
Create a fourth calculation item named YoY % by using the following formula:
DAX
DIVIDE (
    CALCULATE ( SELECTEDMEASURE (), 'Time Intelligence'[Time Calculation] = "YoY" ),
    CALCULATE ( SELECTEDMEASURE (), 'Time Intelligence'[Time Calculation] = "PY" )
)
The year-over-year percentage (YoY %) formula calculates the percentage change of the selected measure over the prior year.
- In the Properties pane, set the Format String Expression property
to:
"0.00%;-0.00%;0.00%"Tip: The format string expression is available to copy and paste from the D:\DP500\Allfiles\07\Assets\Snippets.txt.
-
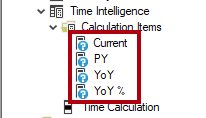
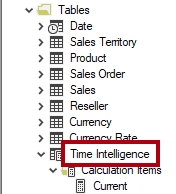
Verify that the Time Intelligence calculation group has four calculation items.
-
To save the changes to the Power BI Desktop model, on the File menu, select Save.
Tip: It’s also possible to select the toolbar button or press Ctrl+S.
-
Switch to Power BI Desktop.
-
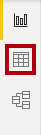
Above the report designer, notice the yellow banner.

-
At the right of the banner, select Refresh now.
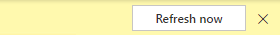
Refreshing applies the changes by creating the calculation group as a model table. It then loads the calculation items as rows of data.
-
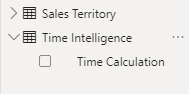
In the Data pane, expand open the Time Intelligence table.
Update the matrix visual
Now you’ll modify the matrix visual to use the Time Calculation column.
-
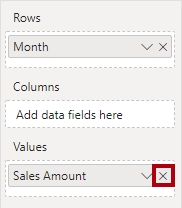
In the report, select the matrix visual.
-
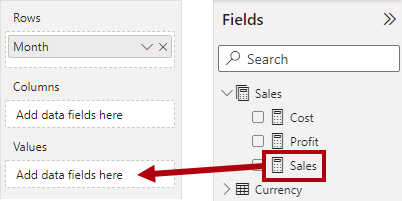
In the Visualizations pane, in the Values well, select X to remove the Sales Amount field.
-
From the Data pane, from inside the Sales table, drag the Sales field into the Values well.
-
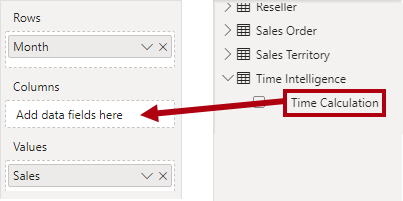
From the Data pane, from inside the Time Intelligence table, drag the Time Calculation field into the Columns well.
-
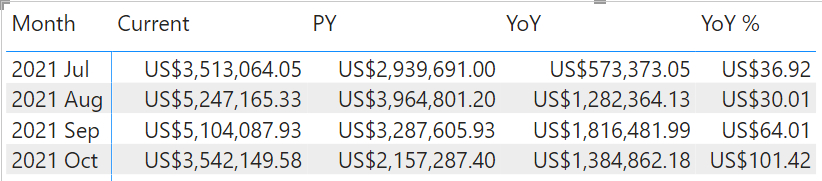
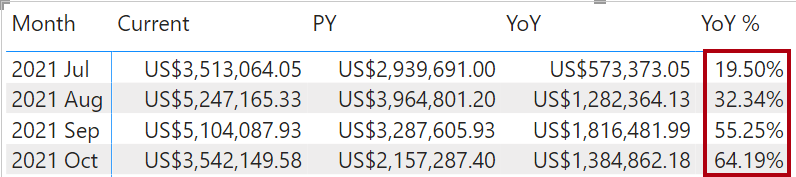
Verify that the matrix visual shows a grid of time-related Sales measure values grouped by month.
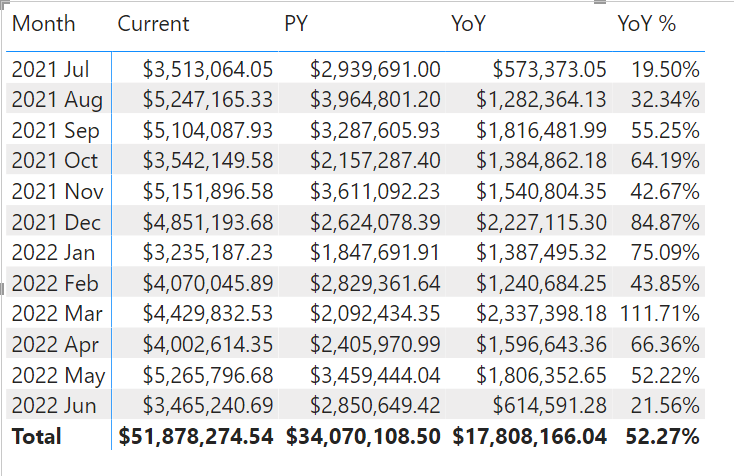
The format of the values is derived from the selected measures. However, recall that you set the format string expression for the YoY % measure to produce a percentage format.
Create the Currency Conversion calculation group
Now you’ll create the Currency Conversion calculation group. It will provide flexibility to convert the Sales table measures to a selected currency. It will also apply appropriate formatting for the selected currency.
-
In Power BI Desktop, switch to Data view.
-
In the Data pane, select the Currency table.
-
Notice the FormatString hidden column that contains format string expressions was column values.
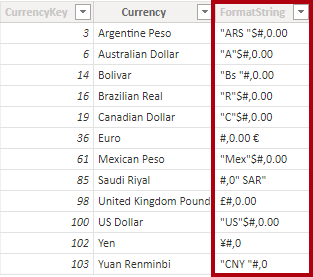
You will use a DAX expression to apply the format string of the selected currency.
-
Switch to Tabular Editor.
-
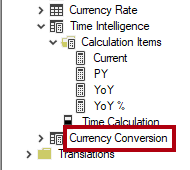
Create a calculation group named Currency Conversion.
Due to the repetition of tasks, briefer instructions are provided. If necessary, you can refer to the steps in the first task of this exercise.
-
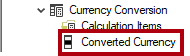
Rename the Name column as Converted Currency.
-
Create a calculation item named Currency Conversion by using the following formula:
DAX
IF (
    HASONEVALUE ( 'Currency'[Currency] ),
    SUMX (
        VALUES ( 'Date'[Date] ),    CALCULATE (
            DIVIDE ( SELECTEDMEASURE (), MAX ( 'Currency Rate'[EndOfDayRate] ) )
        )
    )
)
When there’s only one currency in the filter context, the formula sums daily values of the selected measure that are divided by that day’s end of day rate.
-
In the Properties pane, set the Format String Expression property to the following formula:
DAX
SELECTEDVALUE ( 'Currency'[FormatString] )This formula returns the format string of the selected currency. This way, formatting is dynamically driven by the data in the Currency dimension table.
-
Save the changes to the Power BI Desktop model.
-
Switch to Power BI desktop and refresh the changes.
-
Switch to Report view.

-
Select the matrix visual.
-
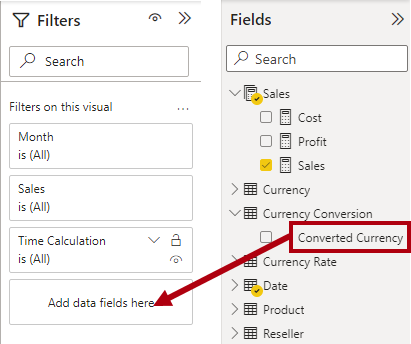
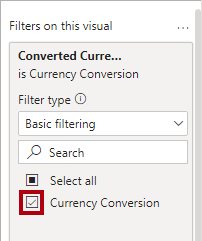
From the Data pane, from within the Currency Conversion table, drag the Converted Currency field into the Filters pane, into the Filter on this visual group.
-
In the filter card, check the Currency Conversion value.
-
Notice that the value formats update to clearly describe US dollar amounts.
-
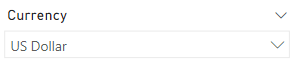
In the Currency slicer, select a different currency, and then in the matrix visual, notice the updated values and formatting.
-
Revert the Currency slicer back to US Dollar.
-
Notice, however, that the YoY % values are no longer percentages.
There’s a problem. Both the Time Intelligence and Currency Conversion calculations groups are applied, but the calculation order is incorrect. Presently, the YoY % calculation happens, then the currency conversion adds daily calculation results over the month. To produce the correct result, the calculation order must be reversed. You can control calculation order by setting precedence values.
Modify calculation group precedence
Now you will modify the calculation group precedence of the two calculation groups.
-
Switch to Tabular Editor.
-
In the left pane, select the Time Intelligence calculation group.
-
In the Properties pane, set the Calculation Group Precedence property to 20.
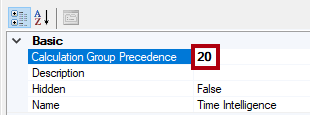
The higher the value the higher the precedence of application. So, the calculation group with the higher precedence is applied first.
-
Set the calculation group precedence for the Currency Conversion calculation group to 10.
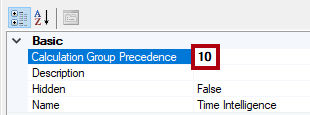
These configurations will ensure the Time Intelligence calculations happen later.
-
Save the changes to the Power BI Desktop model.
-
Switch to Power BI Desktop.
-
Notice that the YoY % values are now percentages.
Finish up
In this task, you’ll finish up.
-
Save the Power BI Desktop file.

-
Close Power BI Desktop.
-
Close Tabular Editor.