Create a star schema model
Overview
The estimated time to complete the lab is 30 minutes
In this lab, you will use Power BI Desktop to develop a data model over the Azure Synapse Adventure Works data warehouse. The data model will allow you to publish a semantic layer over the data warehouse.
In this lab, you learn how to:
-
Create a Power BI connection to an Azure Synapse Analytics SQL pool.
-
Develop model queries.
-
Organize the model diagram.
Get started
In this exercise, prepare your environment.
Load data into Azure Synapse Analytics
Note: If you have already loaded data into Azure Synapse Analytics using a git clone, you can skip this task and proceed to Set up Power BI.
- Sign into the Azure portal with your organizational credentials (or those provided to you).
-
Use the [>_] button to the right of the search bar at the top of the page to create a new Cloud Shell in the Azure portal, selecting a PowerShell environment and creating storage if prompted. The cloud shell provides a command line interface in a pane at the bottom of the Azure portal, as shown here:
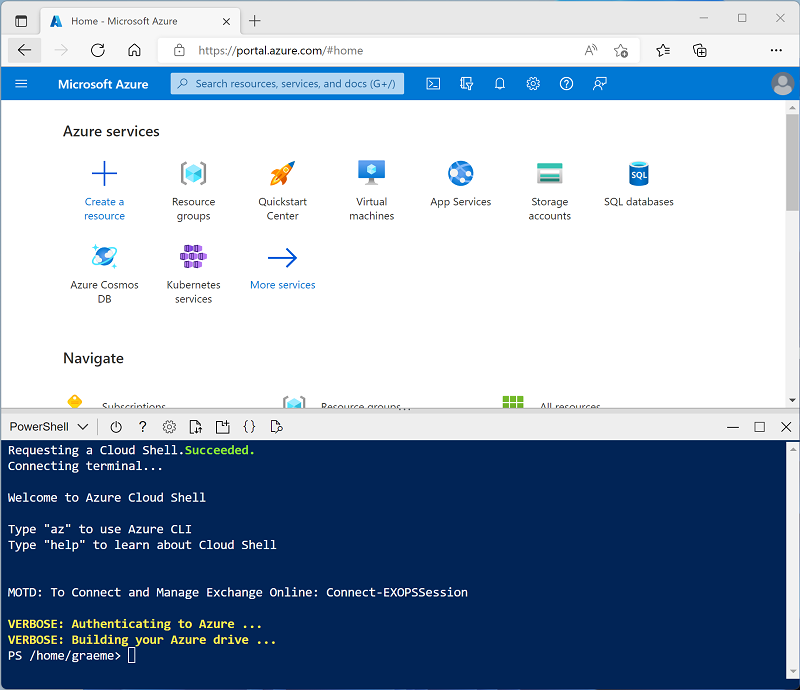
Note: If you have previously created a cloud shell that uses a Bash environment, use the the drop-down menu at the top left of the cloud shell pane to change it to PowerShell.
-
Note that you can resize the cloud shell by dragging the separator bar at the top of the pane, or by using the —, ◻, and X icons at the top right of the pane to minimize, maximize, and close the pane. For more information about using the Azure Cloud Shell, see the Azure Cloud Shell documentation.
-
In the PowerShell pane, enter the following command to clone this repo:
rm -r dp500 -f git clone https://github.com/MicrosoftLearning/DP-500-Azure-Data-Analyst dp500 -
After the repo has been cloned, enter the following commands to change to the setup folder and run the setup.ps1 script it contains:
cd dp500/Allfiles/04 ./setup.ps1 -
When prompted, enter a suitable password to be set for your Azure Synapse SQL pool.
Note: Be sure to remember this password!
- Wait for the script to complete - this typically takes around 20 minutes; but in some cases may take longer.
- After creating the Synapse workspace and SQL Pool and loading the data, the script pauses the pool to prevent unnecessary Azure charges. When you’re ready to work with your data in Azure Synapse Analytics, you’ll need to resume the SQL Pool.
Clone the repository for this course
-
On the start menu, open the Command Prompt

-
In the command prompt window, navigate to the D drive by typing:
d:Press enter.

-
In the command prompt window, enter the following command to download the course files and save them to a folder called DP500.
git clone https://github.com/MicrosoftLearning/DP-500-Azure-Data-Analyst DP500 -
When the repository has been cloned, open the D drive in the file explorer to ensure the files have been downloaded.
Set up Power BI
In this task, you will set up Power BI.
-
To open Power BI Desktop, on the taskbar, select the Power BI Desktop shortcut.
-
Close the getting started window by selecting the X located at the top-right.
-
At the top-right corner of Power BI Desktop, if you’re not already signed in, select Sign In. Use your organizational credentials (or the lab credentials provided to you) to complete the sign in process.
-
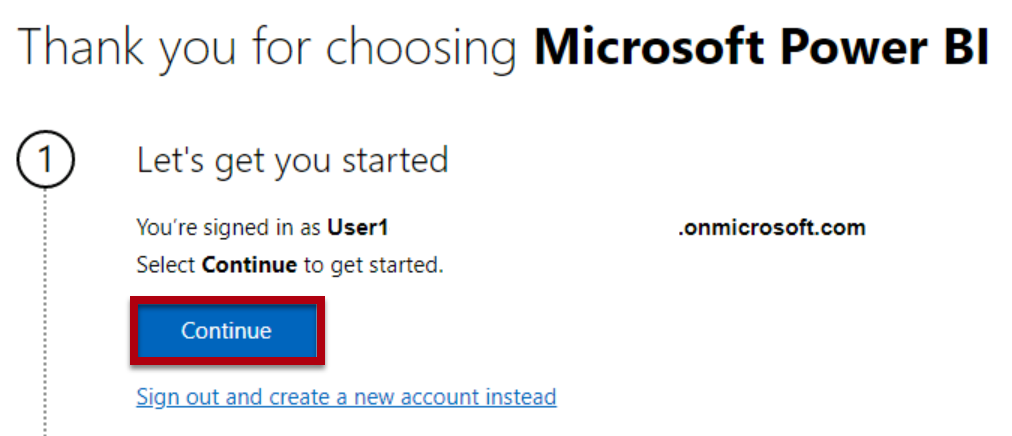
You will be redirected to the Power BI sign-up page in Microsoft Edge. Select Continue to complete the sign up.
-
Enter a 10 digit phone number and select Get started. Select Get started once more. You will be redirected to Power BI.
-
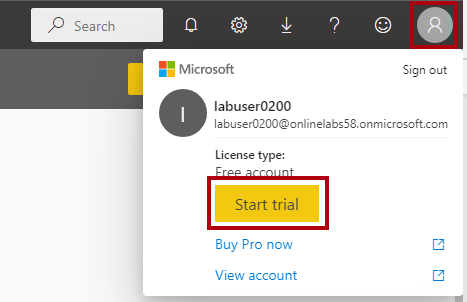
At the top-right, select the profile icon, and then select Start trial.
-
When prompted, select Start trial.
-
Do any remaining tasks to complete the trial setup.
Tip: The Power BI web browser experience is known as the Power BI service.
-
Select Workspaces and Create a Workspace.

-
Create a workspace named DP500 labs and select Save.
Note: The workspace name must be unique within the tenant. If you’re getting an error, change the workspace name.
-
Navigate back to Power BI Desktop. If you see Sign in in the top right corner of the screen, sign-in again using the credentials provided on the Resources tab of the lab environment. If you are already signed in, proceed to the next step.
-
Go to Power BI Desktop and select File then Options and settings then Options then Security and under Authentication Browser check Use my default web browser and select OK. Close Power BI Desktop. Do not save your file.
You will open Power BI Desktop again in the next exercise.
Start the SQL pool
In this task, you will start the SQL pool.
-
In a Microsoft Edge, go to https://portal.azure.com.
-
Use the lab credentials to complete the sign in process.
-
Select Azure Synapse Analytics from Azure services. Select your Synapse workspace.

-
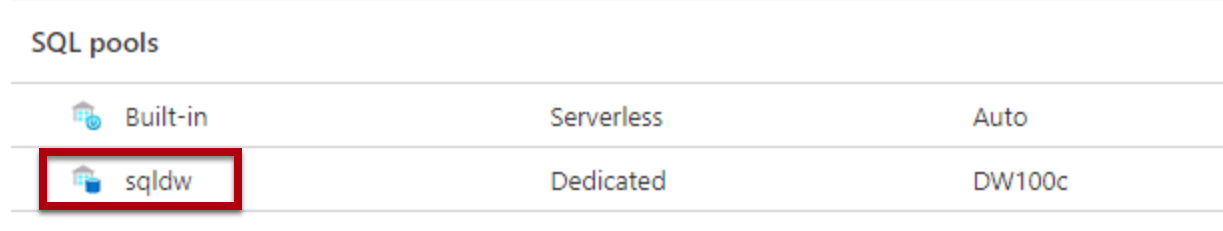
Locate and select the dedicated SQL pool.
-
Resume the SQL pool.

Important: The SQL pool is a costly resource. Please limit the use of this resource when working on this lab. The final task in this lab will instruct you to pause the resource.
Link your Power BI workspace to Azure Synapse Analytics
In this task you will link your existing Power BI workspace to your Azure Synapse Analytics workspace.
-
From the dedicated SQL pool in the Azure Portal, select Open in Synapse Studio from the ribbon.
-
On the home page of Azure Synapse Studio, select Visualize to link your Power BI workspace.

-
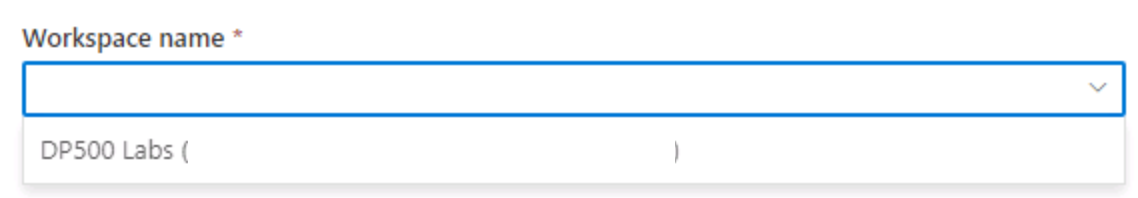
From the Workspace name dropdown, select the workspace you created in the previous task and select Create.

- Navigate to Manage and select Publish all to ensure changes are published.
Develop a data model
In this exercise, you will develop a DirectQuery model to support Power BI analysis and reporting of the data warehouse reseller sales subject.
Download a dataset file
In this task, you will download a Power BI data source file from Synapse Studio.
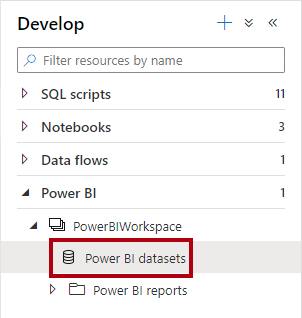
- In the Synapse Studio, on the left, select the Develop hub.

- In the Develop pane, expand Power BI, then expand the workspace, and then select Power BI datasets. If not present, Click Publish all to publish Workspace and refresh the browser.
Note: If you don’t see any data here, confirm that your dedicated SQL pool is running and that your Power BI workspace is linked to your Synapse workspace.
- In the Power BI Datasets pane, select New Power BI Dataset.

- In the left pane, at the bottom, select Start.

- Select your SQL pool, sqldw, and then select Continue.

- To download the .pbids file, select Download.

A .pbids file contains a connection to your SQL pool. It’s a convenient way to start your project. When opened, it will create a new Power BI Desktop solution that already stores the connection details to your SQL pool.
- When the .pbids file has downloaded, open it.
When the file opens, it will prompt you to create queries using the connection. You will define those queries in the next task.
Create model queries
In this task, you will create five Power Query queries that will each load as a table to your model.
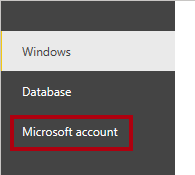
- In Power BI Desktop, in the SQL Server Database window, at the left, select Microsoft Account.
-
Select Sign In.
-
Sign in using the lab Azure credentials provided.
-
Select Connect.

-
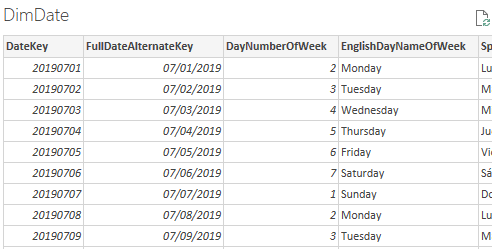
In the Navigator window, select (don’t check) the DimDate table.
-
In the right pane, notice the preview result, which shows a subset of the table rows.
- To create queries (which will become model tables), check the following seven tables:
-
DimDate
-
DimProduct
-
DimProductCategory
-
DimProductSubcategory
-
DimReseller
-
DimSalesTerritory
-
FactResellerSales
- To apply transformations to the queries, at the bottom-right, select Transform Data.

Transforming the data allows you to define what data will be available in your model.
- In the Connection Settings window, select the DirectQuery option.
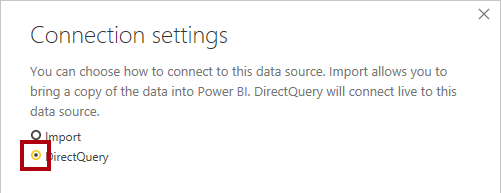
This decision is important. DirectQuery is a storage mode. A model table that uses DirectQuery storage mode doesn’t store data. So, when a Power BI report visual queries a DirectQuery table, Power BI sends a native query to the data source. This storage mode can be used for large data stores like Azure Synapse Analytics (because it could be impractical or uneconomic to import large data volumes) or when near real-time results are required.
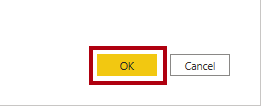
- Select OK.
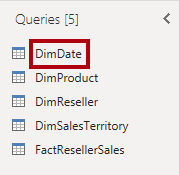
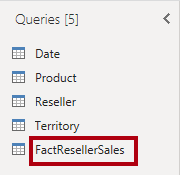
- In the Power Query Editor window, in the Queries pane (located at the left), notice there is one query for each table you checked.
You will now revise the definition of each query. Each query will become a model table when it’s applied to the model. You will now rename the queries, so they’re described in more friendly and concise ways, and apply transformations to deliver the columns required by the known reporting requirements.
- Select the DimDate query.
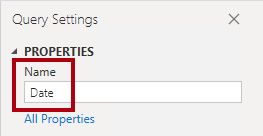
- In the Query Settings pane (located at the right), to rename the query, in the Name box, replace the text with Date, and then press Enter.
- To remove unnecessary columns, on the Home ribbon tab, from inside the Manage Columns group, select the Choose Columns icon.

- In the Choose Columns window, to uncheck all checkboxes, uncheck the first checkbox.

- Check the following five columns.
-
DateKey
-
FullDateAlternateKey
-
EnglishMonthName
-
FiscalQuarter
-
FiscalYear
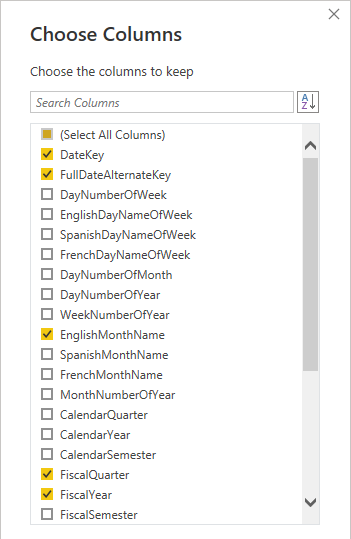
This selection of columns determine what will be available in your model.
- Select OK.

- In the Query Settings pane, in the Applied Steps list, notice that a step was added to remove other columns.
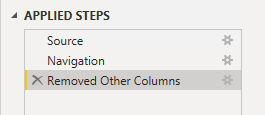
Power Query defines steps to achieve the desired structure and data. Each transformation is a step in the query logic.
-
To rename the FullDateAlternateKey column, double-click the FullDateAlternateKey column header.
-
Replace the text with Date, and then press Enter.
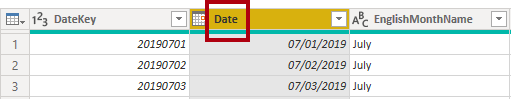
- Notice that a new applied step is added to the query.

- Rename the following columns:
-
EnglishMonthName as Month
-
FiscalQuarter as Quarter
-
FiscalYear as Year
- To validate the query design, in the status bar (located along the bottom of the window), verify that the query has five columns.

Important: If the query design does not match, review the exercise steps to make any corrections.
The design of the Date query is now complete.
- In the Applied Steps pane, right-click the last step, and then select View Native Query.
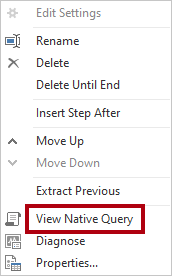
- In the Native Query window, review the SELECT statement that reflects the query design.
This concept is important. A native query is what Power BI uses to query the data source. To ensure best performance, the database developer should ensure this query is optimized by creating appropriate indexes, etc.
- To close the Native Query window, select OK.

-
Select the DimProductCategory table.
-
Rename the query to Product Details.
-
On the home tab of the ribbon, in the Combine group, select Merge Queries.
Note: We are merging queries to get the product details, category and sub category. This will be used in the Product dimension.
- Select the DimProductSubcategory table and select the ProductCategoryKey Column in each table. Select OK.
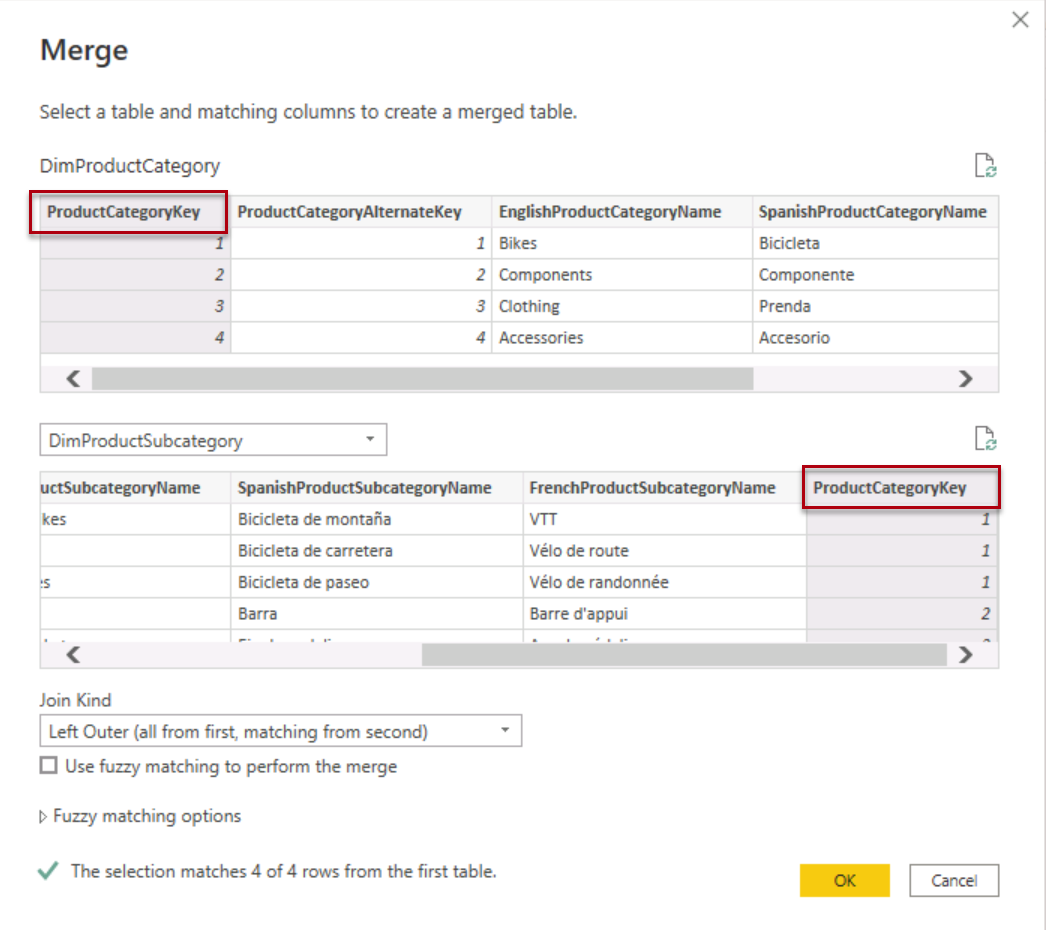
Note: Use the default join for this merge, which is a left outer join.
- Expand the DimProductSubcategory column. Select the ProductSubcategoryKey and the EnglishProductSubcategoryName columns. De-select Use original column name as prefix.

The Expand feature allows joining tables based on foreign key constraints in the source data. The design approach taken by this lab is to join snowflake dimension tables together to produce a denormalized representation of the data.
-
Select OK.
-
Rename the DimProductSubcategory.ProductSubcategoryKey column to ProductSubcategoryKey and DimProductSubcategory.EnglishProductSubcategoryName to EnglishProductSubcategoryName.
-
Remove all columns, except:
-
ProductSubcategoryKey
-
EnglishProductCategoryName
-
EnglishProductSubcategoryName
You should now have three columns with 37 rows.
- Select the DimProduct query.

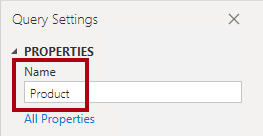
- Rename the query as Product.
-
On the home tab of the ribbon, in the Combine group, select Merge Queries.
-
Select the Product Details table and select the ProductSubcategoryKey column in both the Product table and the Product details table.
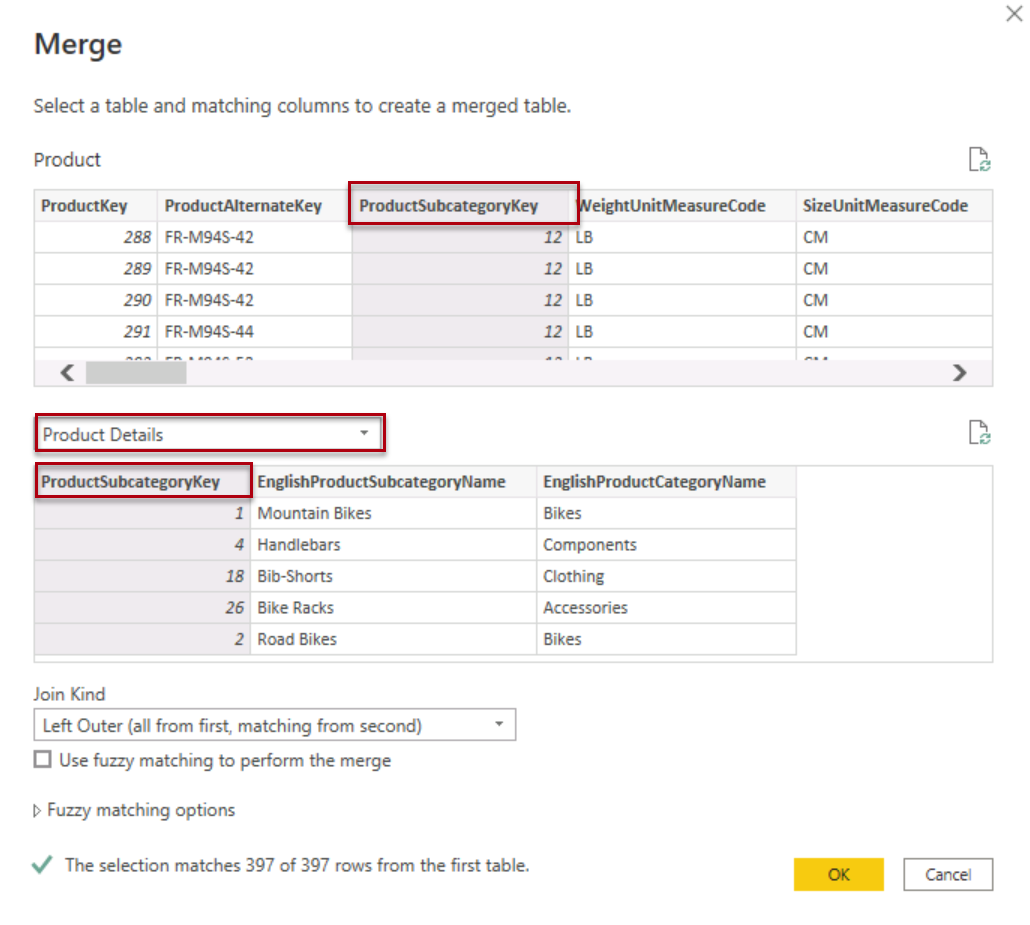
-
Select OK.
-
Expand the Product Details column and select the EnglishProductSubcategoryName and the EnglishProductCategoryName columns.
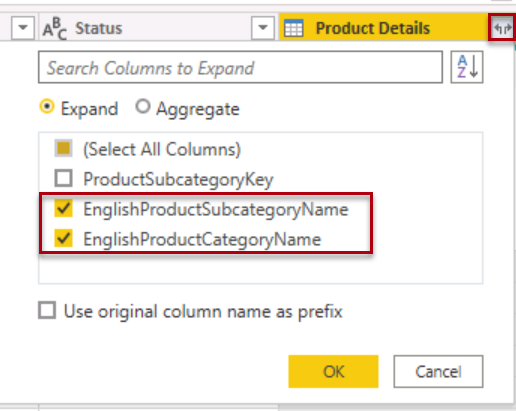
-
Select OK.
-
To filter the query, in the FinishedGoodsFlag column header, open the dropdown menu, uncheck FALSE.

-
Select OK.
-
Rename the following columns:
-
EnglishProductName as Product
-
Product Details.EnglishProductCategoryName as Category
-
Product Details.EnglishProductSubcategoryName as SubCategory
- Remove all columns, except:
-
ProductKey
-
Product
-
Color
-
Subcategory
-
Category
- In the Applied Steps pane, right-click the last step, and then select View Native Query.

-
In the Native Query window, review the SELECT statement that reflects the query design.
-
To close the Native Query window, select OK.
-
Verify that the query has five columns.
The design of the Product query is now complete.
- Select the DimReseller query.

-
Rename the query as Reseller.
-
Remove all columns, except:
-
ResellerKey
-
BusinessType
-
ResellerName
- Rename the following columns:
-
BusinessType as Business Type (separate with a space)
-
ResellerName as Reseller
- Verify that the query has three columns.
The design of the Reseller query is now complete.
- Select the DimSalesTerritory query.

-
Rename the query as Territory.
-
Remove all columns, except:
-
SalesTerritoryKey
-
SalesTerritoryRegion
-
SalesTerritoryCountry
-
SalesTerritoryGroup
- Rename the following columns:
-
SalesTerritoryRegion as Region
-
SalesTerritoryCountry as Country
-
SalesTerritoryGroup as Group
- Verify that the query has four columns.
The design of the Territory query is now complete.
- Select the FactResellerSales query.
-
Rename the query as Sales.
-
Remove all columns, except:
-
ResellerKey
-
ProductKey
-
OrderDateKey
-
SalesTerritoryKey
-
OrderQuantity
-
UnitPrice

- Rename the following columns:
-
OrderQuantity as Quantity
-
UnitPrice as Price
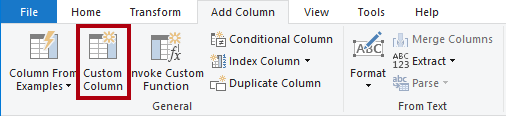
- To add a calculated column, on the Add Column ribbon tab, from inside the General group, select Custom Column.
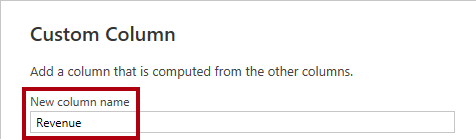
- In the Custom Column window, in the New Column Name box, replace the text with Revenue.
- In the Custom Column Formula box, enter the following formula:
[Quantity] * [Price]
-
Select OK.
-
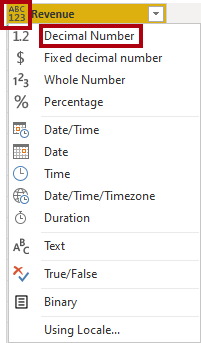
To modify the column data type, in the Revenue column header, select ABC123, and then select Decimal Number.
-
Review the native query, noticing the Revenue column calculation logic.
-
Verify that the query has seven columns.
The design of the Sales query is now complete.
- Right-click on the Product Details table and de-select Enable load. This will disable the load of the Product Details table to the data model, and it will not appear in the report.
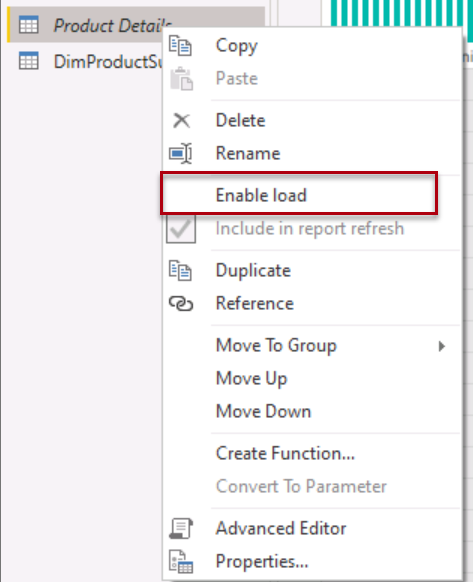
-
Repeat this step, de-selecting Enable load, for the DimProductSubcategory table.
-
To apply the queries, on the Home ribbon tab, from inside the Close group, select the Close & Apply icon.
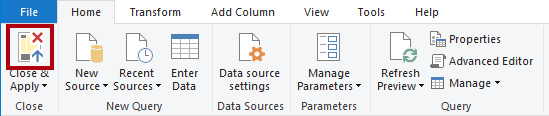
Each query is applied to create a model table. Because the data connection is using DirectQuery storage mode, only the model structure is created. No data is imported. The model now consists of one table for each query.
- In Power BI Desktop, when the queries have been applied, at the bottom-left corner in the status bar, notice that the model storage mode is DirectQuery.

Organize the model diagram
In this task, you will organize the model diagram to easily understand the star schema design.
- In Power BI Desktop, at the left, select Model view.

- To resize the model diagram to fit to screen, at the bottom-right, select the Fit to screen icon.

-
Drag the tables into position so that the Sales fact table is located at the middle of the diagram, and the remaining tables, which are dimension tables, are located around the fact table.
-
If any of the dimension tables aren’t related to the fact table, use the following instructions to create a relationship:
-
Drag the dimension key column (for example, ProductKey) and drop it on the corresponding column of the Sales table.
-
In the Create Relationship window, select OK.
- Review the final layout of the model diagram.

The creation of the star schema model is now complete. There are many modeling configurations that could now be applied, like adding hierarchies, calculations, and setting properties like column visibility.
-
To save the solution, at the top-left, select the File menu and from there select Save as.
-
In the Save As window, go to the D:\DP500\Allfiles\04\MySolution folder.
-
In the File name box, enter Sales Analysis.

-
Select Save.
-
Close Power BI Desktop.
Pause the SQL pool
In this task, you will stop the SQL pool.
-
In a web browser, go to https://portal.azure.com.
-
Locate the SQL pool.
-
Pause the SQL pool.