M08-Unit 3 Monitor a load balancer resource using Azure Monitor
Exercise scenario
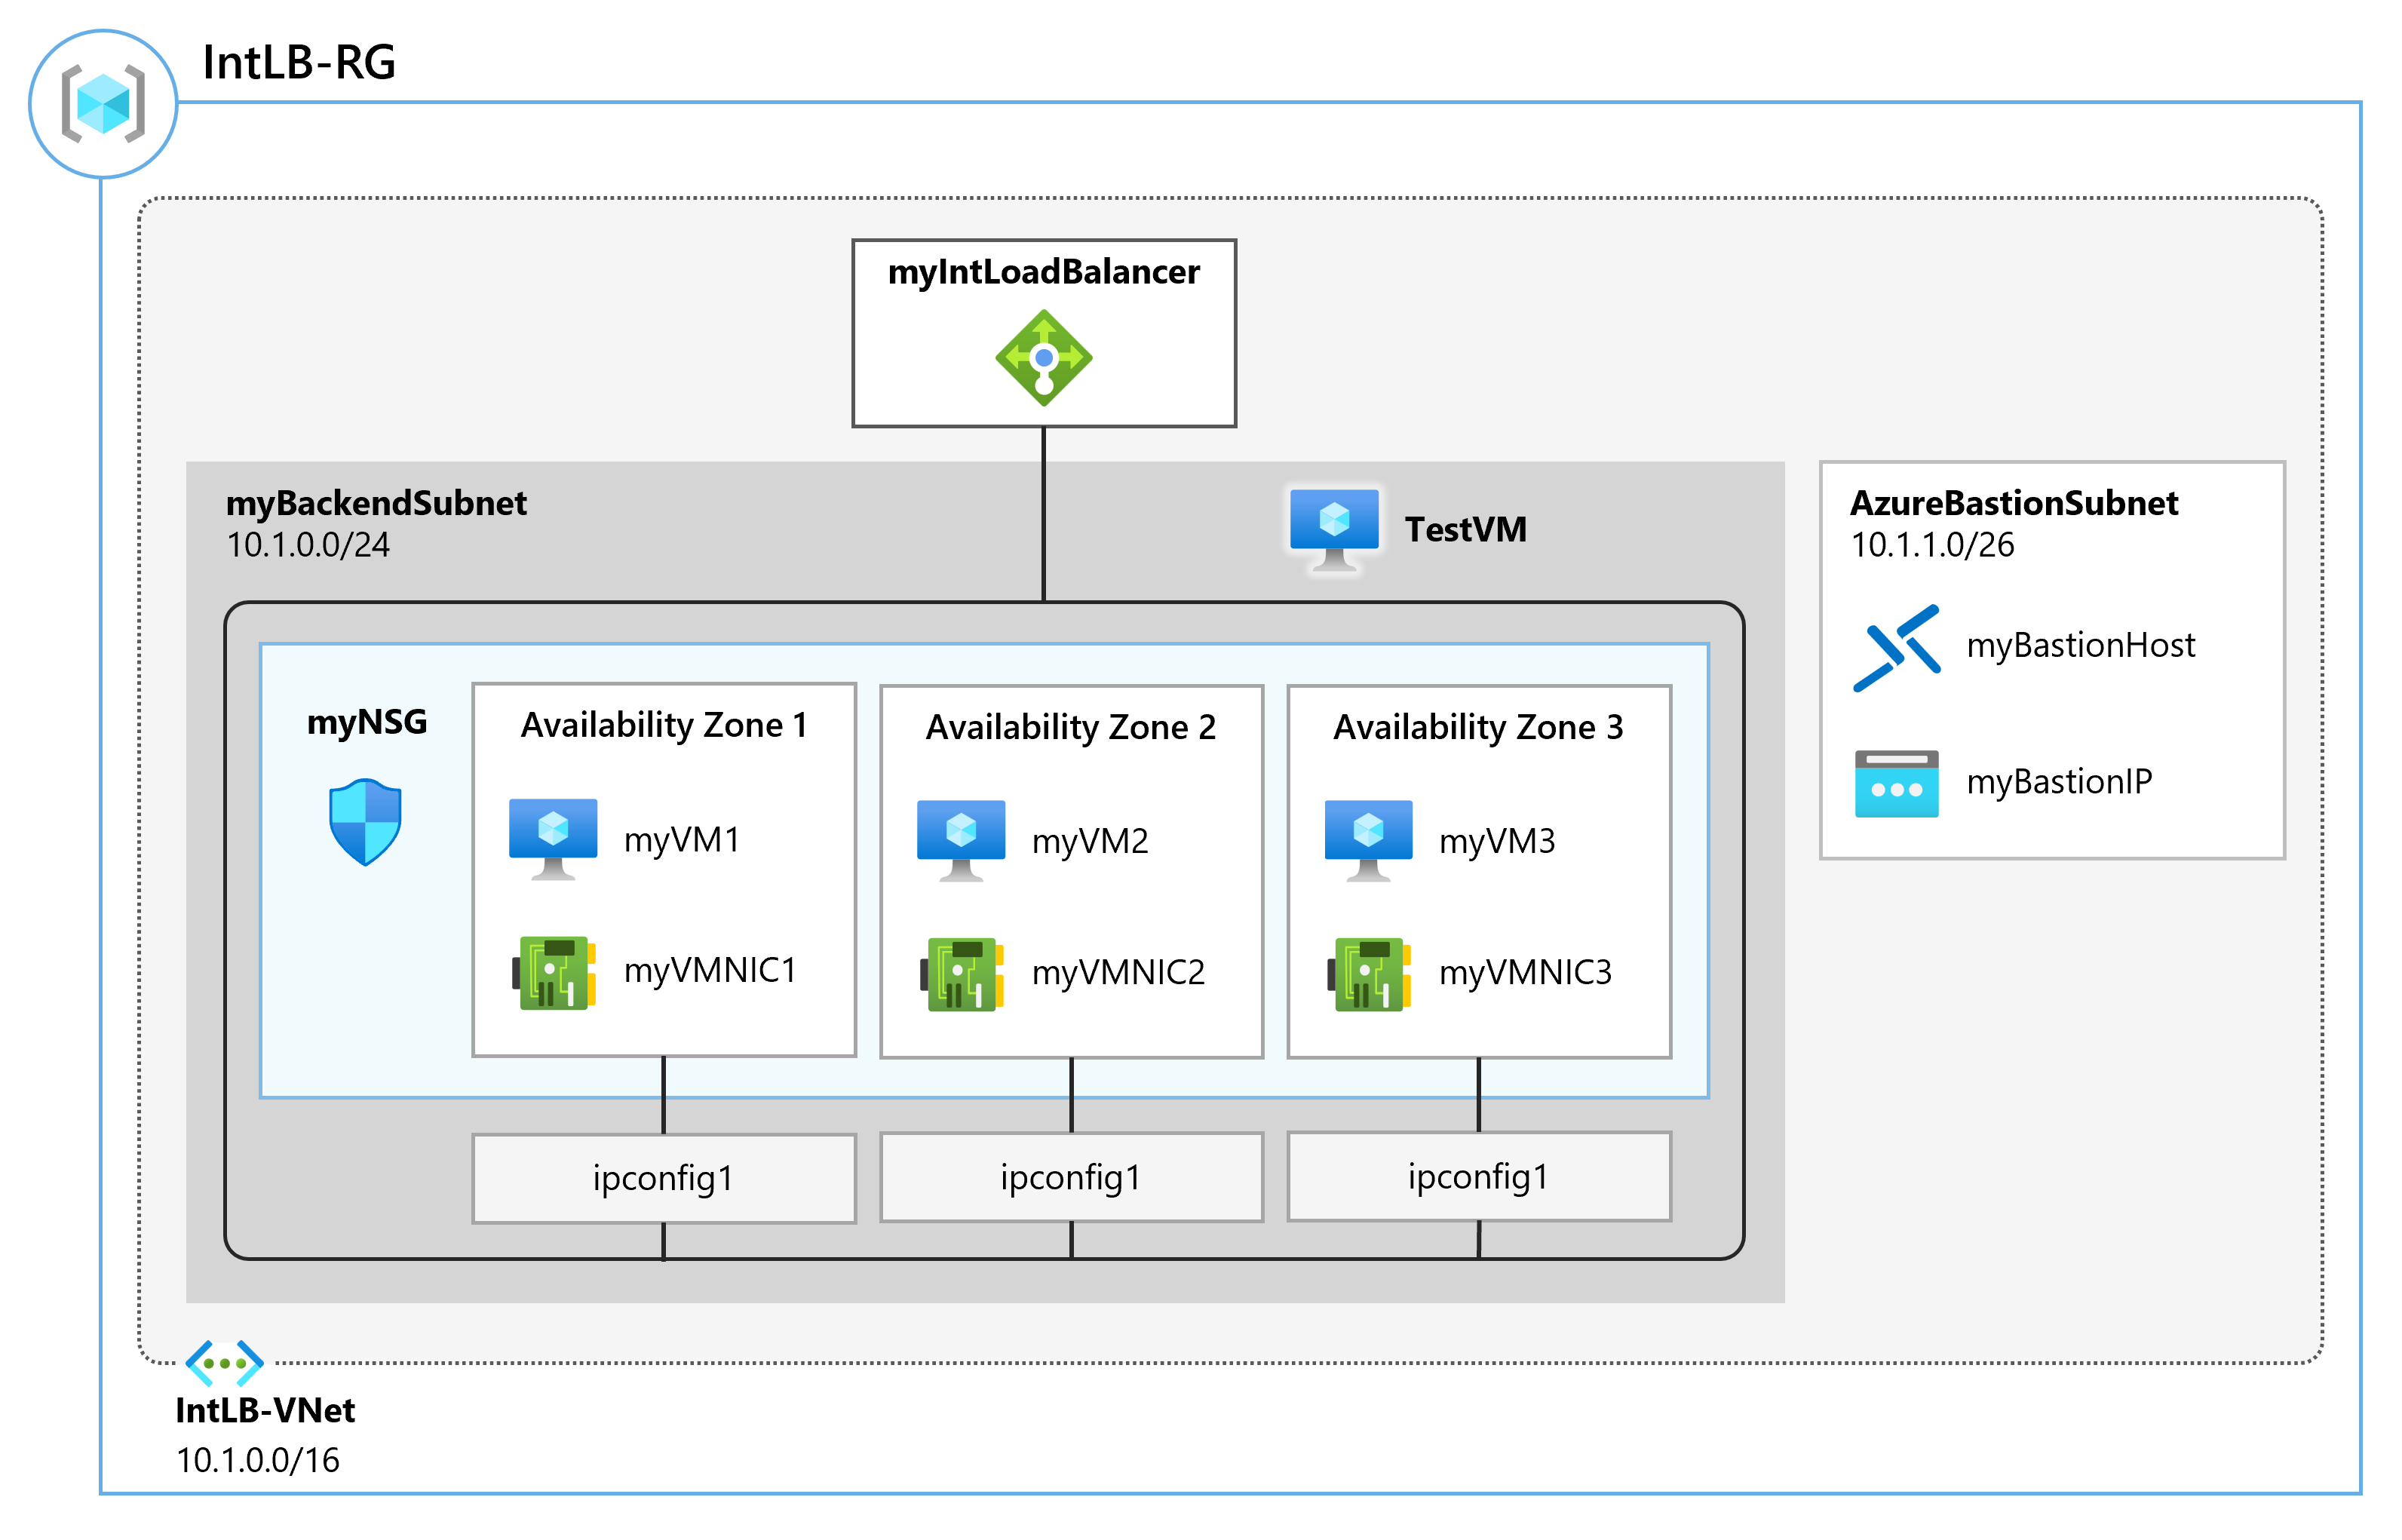
In this exercise, you will create an internal load balancer for the fictional Contoso Ltd organization. Then you will create a Log Analytics workspace, and use Azure Monitor Insights to view information about your internal load balancer. You will view the Functional Dependency View, then view detailed metrics for the load balancer resource, and view resource health information for the load balancer. Finally, you will configure the load balancer’s diagnostic settings to send metrics to the Log Analytics workspace you created.
The diagram below illustrates the environment you will be deploying in this exercise.
Estimated time: 55 minutes
Job skills
In this exercise, you:
- Task 1: Create the virtual network
- Task 2: Create the load balancer
- Task 3: Create a backend pool
- Task 4: Create a health probe
- Task 5: Create a load balancer rule
- Task 6: Create backend servers
- Task 7: Add VMs to the backend pool
- Task 8: Test the load balancer
- Task 9: Create a Log Analytics Workspace
- Task 10: Use Functional Dependency View
- Task 11: View detailed metrics
- Task 12: View resource health
- Task 13: Configure diagnostic settings
Task 1: Create the virtual network
In this section, you will create the virtual network and subnets.
-
Log in to the Azure portal.
-
In the Azure portal, search for and select Virtual Networks.
-
Select + Create.
-
On the Basics tab, use the information in the table below to create the virtual network.
Setting Value Subscription Select your subscription Resource group Select Create new
Name: IntLB-RGName IntLB-VNet Region (US) West US -
Select Next : Security.
-
Under BastionHost select Enable, then enter the information from the table below.
Setting Value Bastion name myBastionHostPublic IP address Select Create new and change the Name to myBastionIP -
Select Next : Address Space.
-
Ensure the virtual network IP address is 10.1.0.0/16.
-
Ensure the default subnet IP address range is 10.1.0.0 - 10.1.0.255 with /24. Change the name to
myBackendSubnet. -
Ensure Enable private network (no default outbound access) is not checked. Save your changes.
-
Ensure the AzureBastionSubnet is 10.1.1.0 - 10.1.1.63 with /26.
-
Select Review + create.
-
Select Create.
-
This task will create a virtual network with two subnets as shown on the architecture diagram.
-
Monitor the Notifications to ensure the deployment succeeds.
Task 2: Create the load balancer
In this section, you will create an internal Standard SKU load balancer. The reason we are creating a Standard SKU load balancer here in the exercise, instead of a Basic SKU load balance, is for later exercises that require a Standard SKU version of the load balancer.
-
In the Azure portal, search for and select Load Balancers
-
Select Create, and then Standard Load Balancer.
-
On the Basics tab, use the information in the table below to create the load balancer.
Setting Value Subscription Select your subscription Resource group IntLB-RG Name myIntLoadBalancerRegion West US SKU Standard Type Internal -
Move to the Frontend IP configuration tab and select + Add a frontend IP configuration.
Setting Value Name LoadBalancerFrontEndVirtual network IntLB-VNet Subnet myBackendSubnet IP address assignment Dynamic -
Save your changes, then select Review + create.
-
After a successful validation, select Create.
Task 3: Create a backend pool
The backend address pool contains the IP addresses of the virtual NICs connected to the load balancer.
-
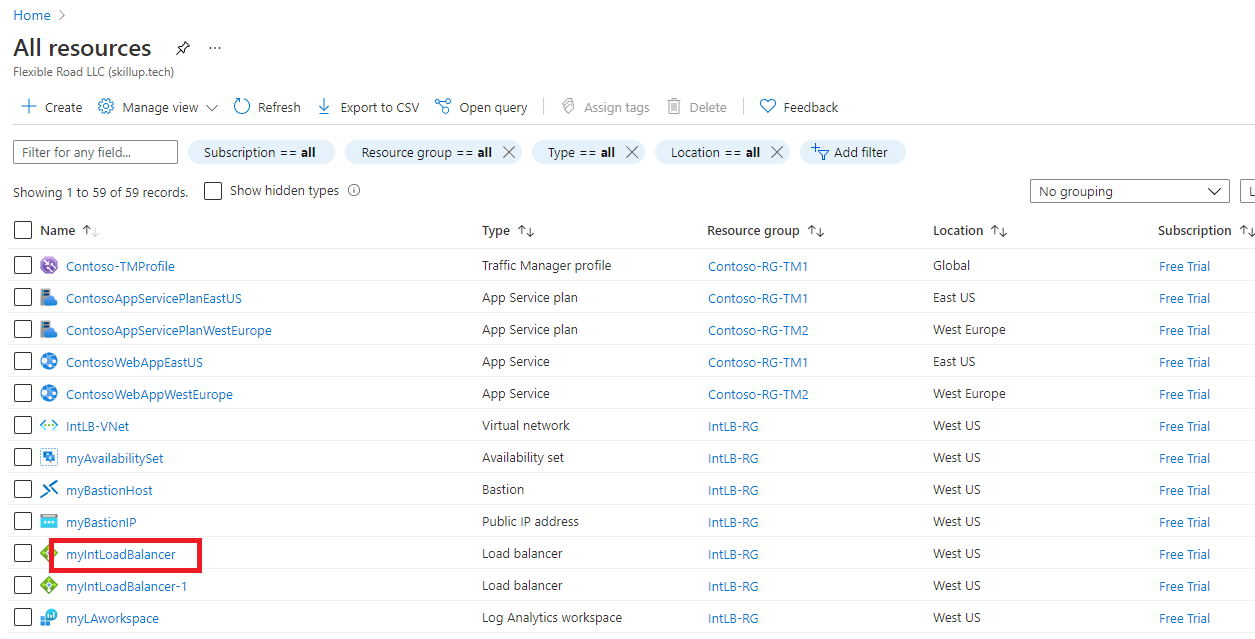
In the Azure portal, search for and select the myIntLoadBalancer resource.
-
Under Settings, select Backend pools, and then select Add.
-
On the Add backend pool page, enter the information from the table below.
Setting Value Name myBackendPool Virtual network IntLB-VNet Backend Pool Configuration NIC -
Select Save.
Task 4: Create a health probe
The load balancer monitors the status of your app with a health probe. The health probe adds or removes VMs from the load balancer based on their response to health checks. Here you will create a health probe to monitor the health of the VMs.
-
For the load balancer resource, select Settings, select Health probes, then select Add.
-
On the Add health probe page, enter the information from the table below.
Setting Value Name myHealthProbeProtocol HTTP Port 80 Path / Interval 15 -
Select Save.
Task 5: Create a load balancer rule
A load balancer rule is used to define how traffic is distributed to the VMs. You define the frontend IP configuration for the incoming traffic and the backend IP pool to receive the traffic. The source and destination port are defined in the rule. Here you will create a load balancer rule.
-
For the load balancer resource, select Settings, select Load balancing rules, then select Add.
Setting Value Name myHTTPRule IP Version IPv4 Frontend IP address LoadBalancerFrontEnd Backend pool myBackendPool Protocol TCP Port 80 Backend port 80 Health probe myHealthProbe Session persistence None Idle timeout (minutes) 15 Enable TCP Reset Disabled Floating IP Disabled
Task 6: Create backend servers
In this section, you will create three VMs for the backend pool of the load balancer, add the VMs to the backend pool, and then install IIS on the three VMs to test the load balancer.
- In the Azure portal, select the Cloud Shell icon (top right). If necessary, configure the shell.
- Select PowerShell.
- Select No Storage Account required and your Subscription, then select Apply.
- Wait for the terminal to create and a prompt to be displayed.
-
On the toolbar of the Cloud Shell pane, select the Manage files icon, in the drop-down menu, select Upload and upload the following files azuredeploy.json and azuredeploy.parameters.json into the Cloud Shell home directory.
Note: If you are working in your own subscription the template files are available in the GitHub lab repository. Make sure to use Lab 08.
-
Deploy the following ARM templates to create the virtual network, subnets, and VMs needed for this exercise. Note: You will be prompted to provide an admin password. Make a note of your password, it will be required in later steps.
$RGName = "IntLB-RG" New-AzResourceGroupDeployment -ResourceGroupName $RGName -TemplateFile azuredeploy.json -TemplateParameterFile azuredeploy.parameters.json -Verbose -
Deployment may take several minutes. You can check the progress in the portal by refreshing the virtual machine resource page.
- The VMs must be deployed and running before proceeding to the next step.
Task 7: Add VMs to the backend pool
-
In the Azure portal, search for and select the myIntLoadBalancer resource.
-
Under Settings, select Backend pools., and then select myBackendPool.
-
In the IP configurations section, select Add.
-
Select all the virtual machines that are shown, then select Add.
-
Select the checkboxes for myVM1 and myVM2 then select Add.
-
On the myBackendPool page, select Save.
Task 8: Test the load balancer
In this section, you will create a test VM, and then test the load balancer.
Connect to the test VM (VM3) to test the load balancer
-
In the Azure portal, search for and select the myIntLoadBalancer resource.
-
On the Overview page, make a note of the Private IP address, or copy it to the clipboard. Note: you may have to select See more to see the Private IP address.
-
Search for and select myVM3.
-
Select Connect, and then Connect via Bastion.
-
In the Username box, enter TestUser and in the Password box, enter the password you provided during deployment, then select Connect.
-
If there is a popup blocker error, allow popups using the icon at the end of URL.
-
The myTestVM window will open in another browser tab.
-
If a Networks pane appears, select Yes.
-
Select the Internet Explorer icon in the task bar to open the web browser. Be sure it is the icon inside the virtual machine.
-
Select OK on the Set up Internet Explorer 11 dialog box.
-
Enter (or paste) the load balancer IP address (e.g. 10.1.0.4).
-
One of the two backend servers virtual machines (myVM1 or myVM2) will respond. Continue refreshing the page, and notice the response comes randomly from the backend servers.
Task 9: Create a Log Analytics Workspace
-
In the Azure portal, search for and select the Log Analytics workspaces resource.
-
Select Create.
-
On the Create Log Analytics workspace page, on the Basics tab, use the information in the table below to create the workspace.
Setting Value Subscription Select your subscription Resource group IntLB-RG Name myLAworkspace Region West US -
Select Review + Create, then select Create.
Task 10: Use Functional Dependency View
-
In the Azure portal, search for and select the myIntLoadBalancer resource.
-
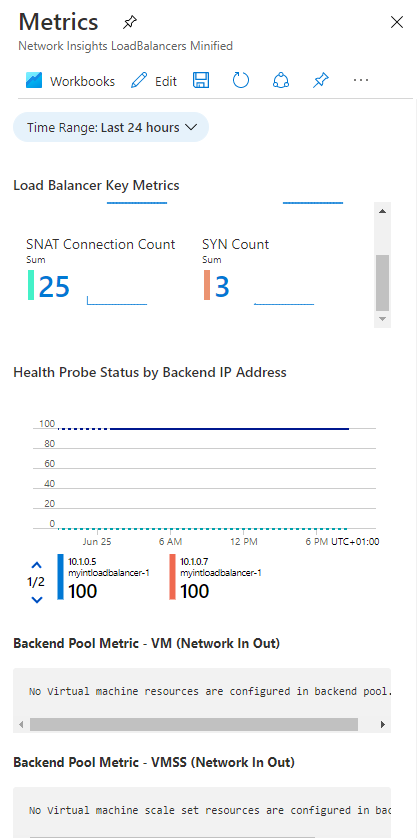
Under Monitoring, select Insights.
-
The Metrics pane provides a quick view of some key metrics for this load balancer resource, in the form of bar and line charts.
Task 11: View detailed metrics
-
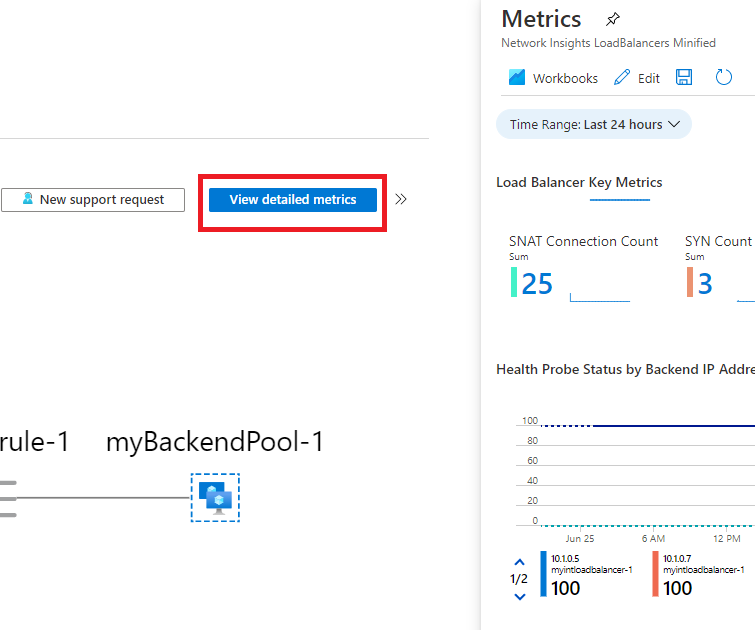
To view more comprehensive metrics for this network resource, select View detailed metrics.
-
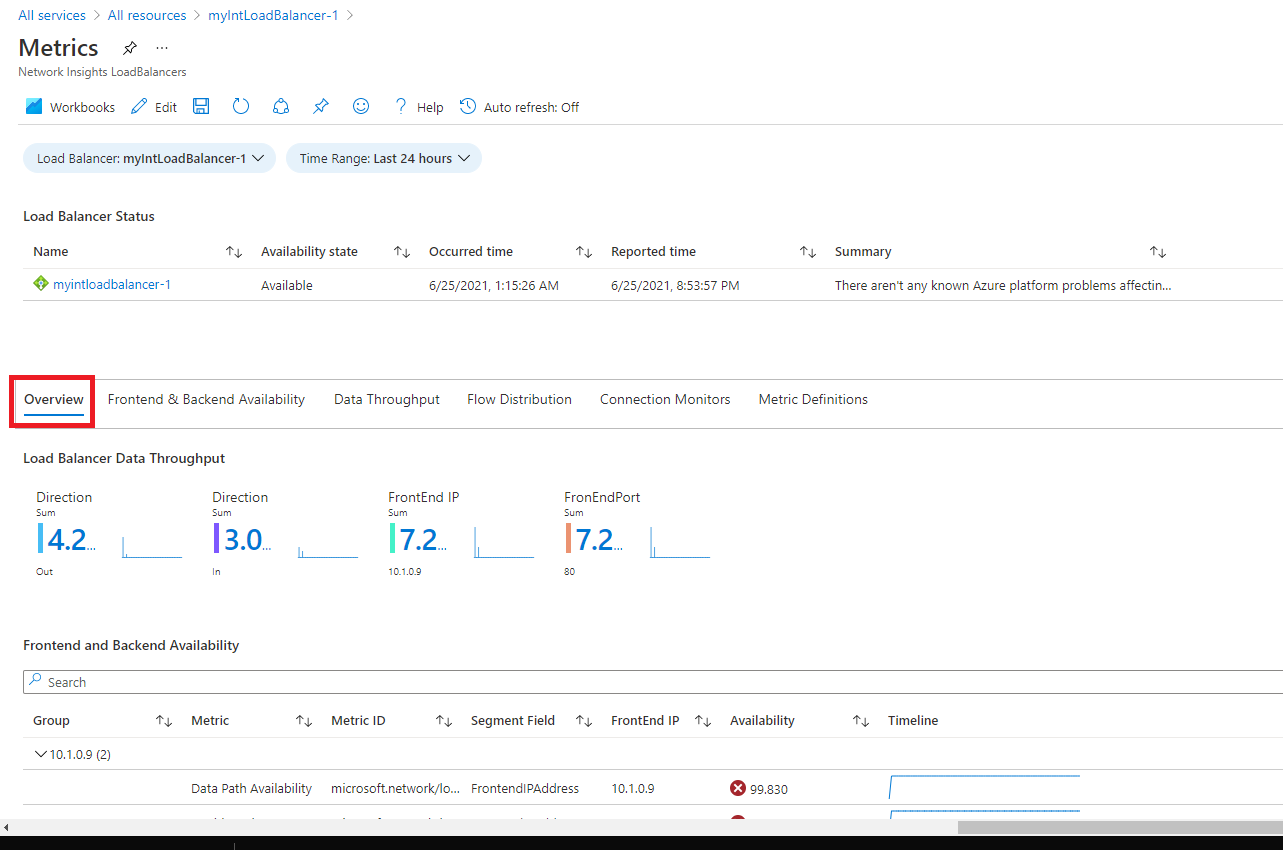
This opens a large full Metrics page in the Azure Network Insights platform. The first tab you land on is the Overview tab, which shows the availability status of the load balancer and overall Data Throughput and Frontend and Backend Availability for each of the Frontend IPs attached to your Load Balancer. These metrics indicate whether the Frontend IP is responsive and the compute instances in your Backend Pool are individually responsive to inbound connections.
-
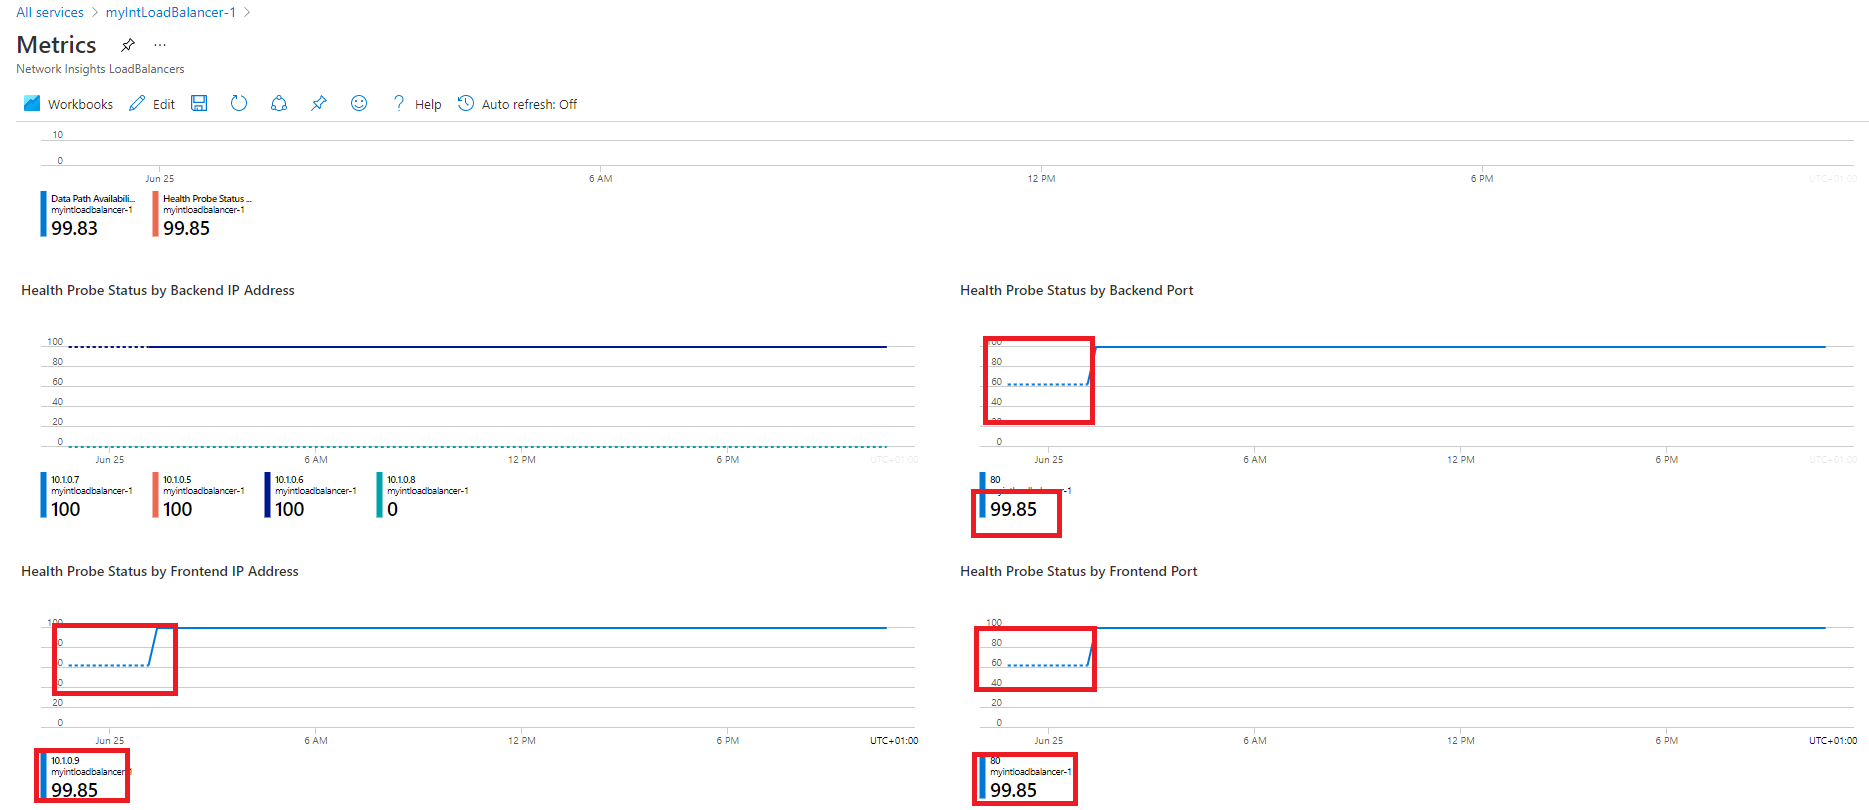
Select the Frontend & Backend Availability tab and scroll down the page to see the Health Probe Status charts. If you see values that are lower than 100 for these items, it indicates an outage of some kind on those resources.
-
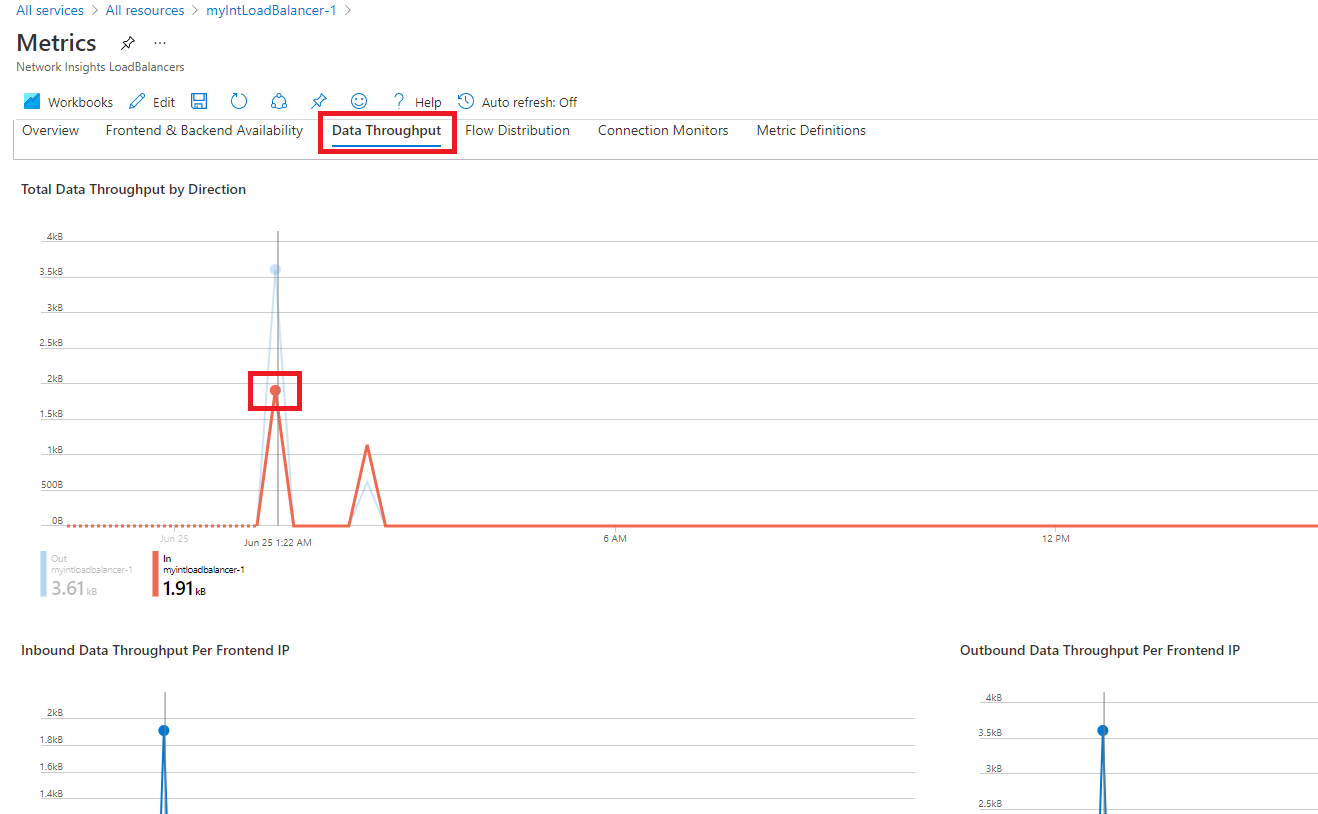
Select the Data Throughput tab and scroll down the page to see the other data throughput charts.
-
Hover over some of the data points in the charts, and you will see that the values change to show the exact value at that point in time.
-
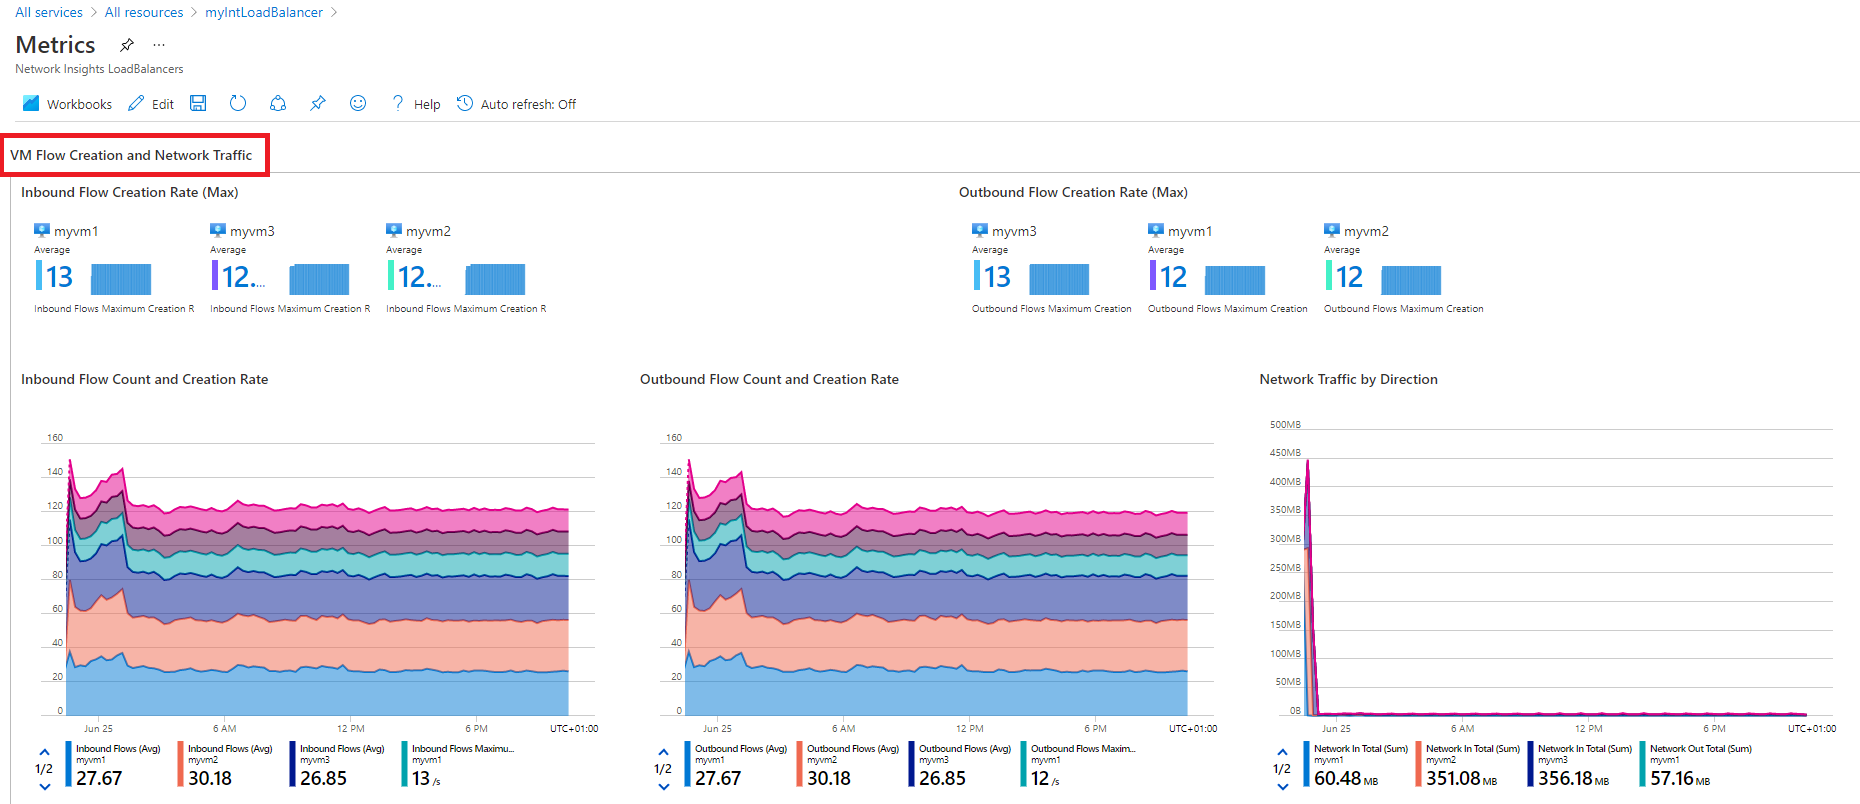
Select the Flow Distribution tab and scroll down the page to see the charts under the VM Flow Creation and Network Traffic section.
Task 12: View resource health
-
To view the health of your Load Balancer resources, on the Azure portal home page, select All services, then select Monitor.
-
On the Monitor>Overview page, in the left-hand menu select Service Health.
-
On the Service Health>Service issues page, in the left-hand menu select Resource Health.
-
On the Service Health>Resource health page, in the Resource type drop-down list, scroll down the list and select Load balancer.
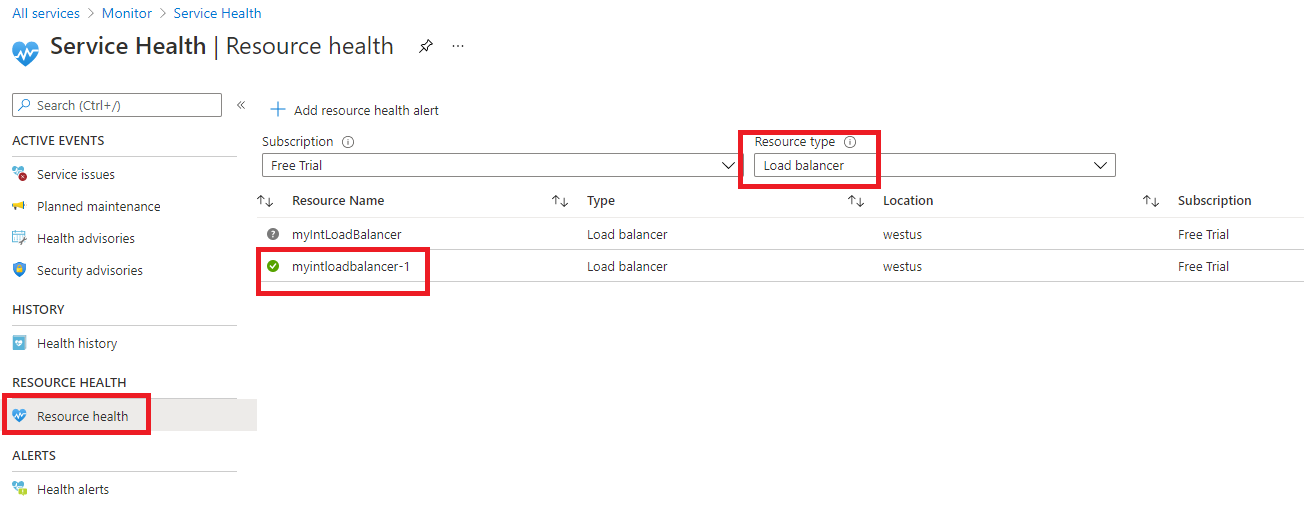
-
Then select the name of your load balancer from the list.
-
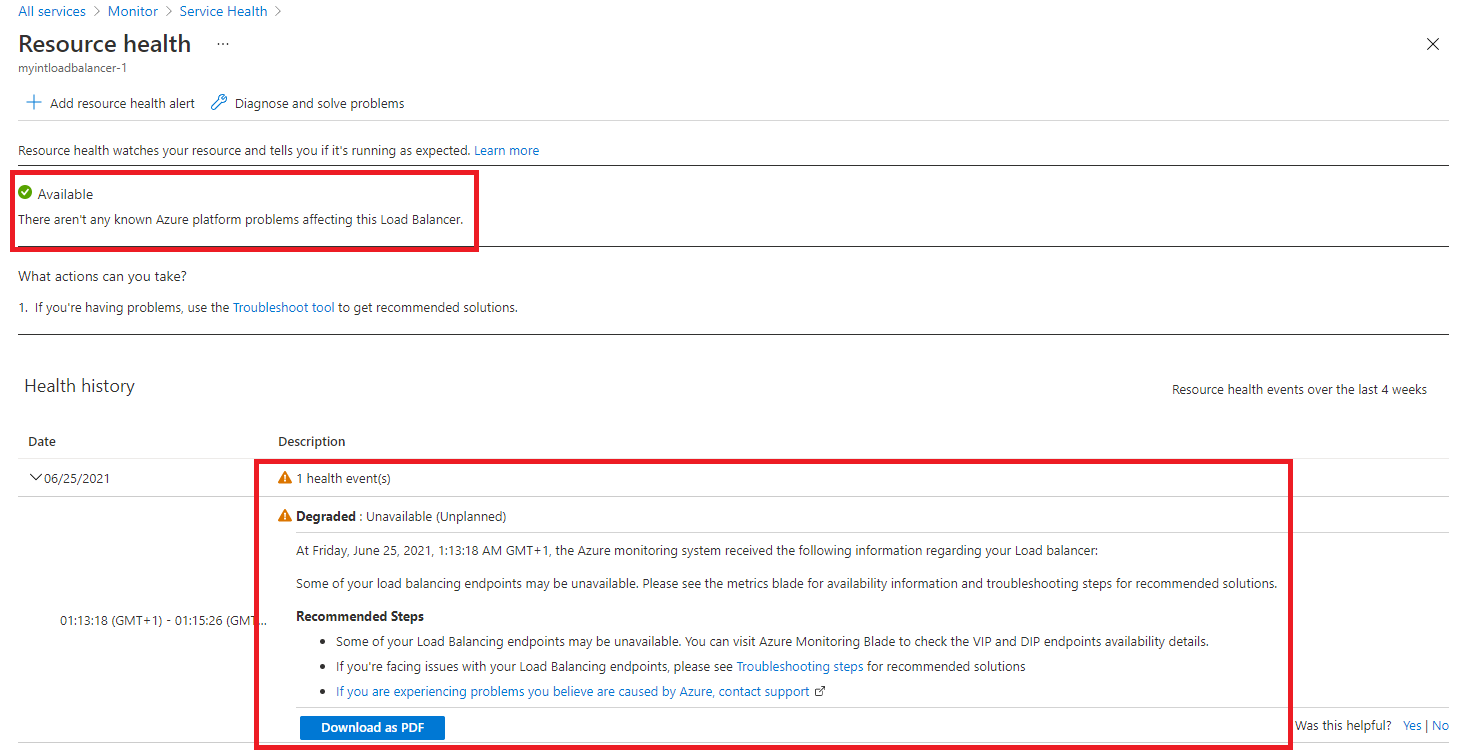
The Resource health page will identify any major availability issues with your load balancer resource. If there are any events under the Health History section, you can expand the health event to see more detail about the event. You can even save the detail about the event as a PDF file for later review and for reporting.
Task 13: Configure diagnostic settings
-
On the Azure portal home page, select Resource groups, then select the IntLB-RG resource group from the list.
-
On the IntLB-RG page, select the name of the myIntLoadBalancer load balancer resource in the list of resources.
-
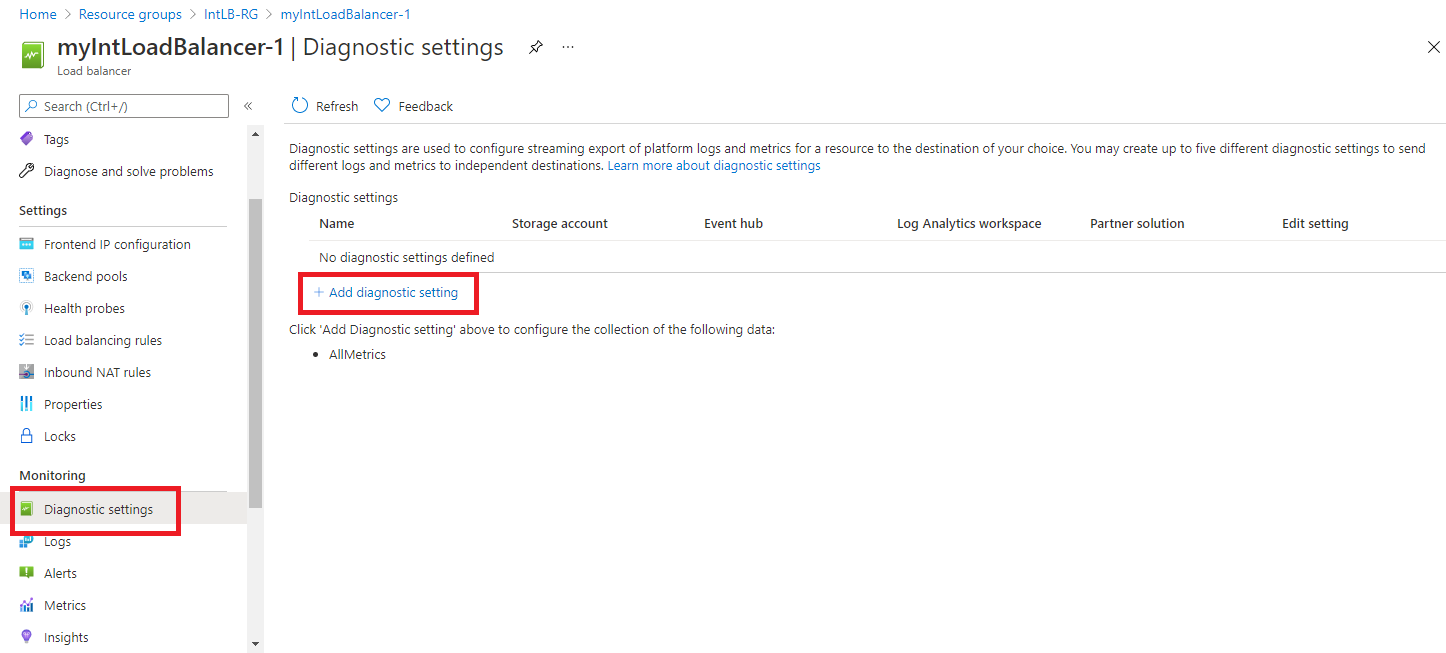
Under Monitoring, select Diagnostic settings, then select Add diagnostic setting.
-
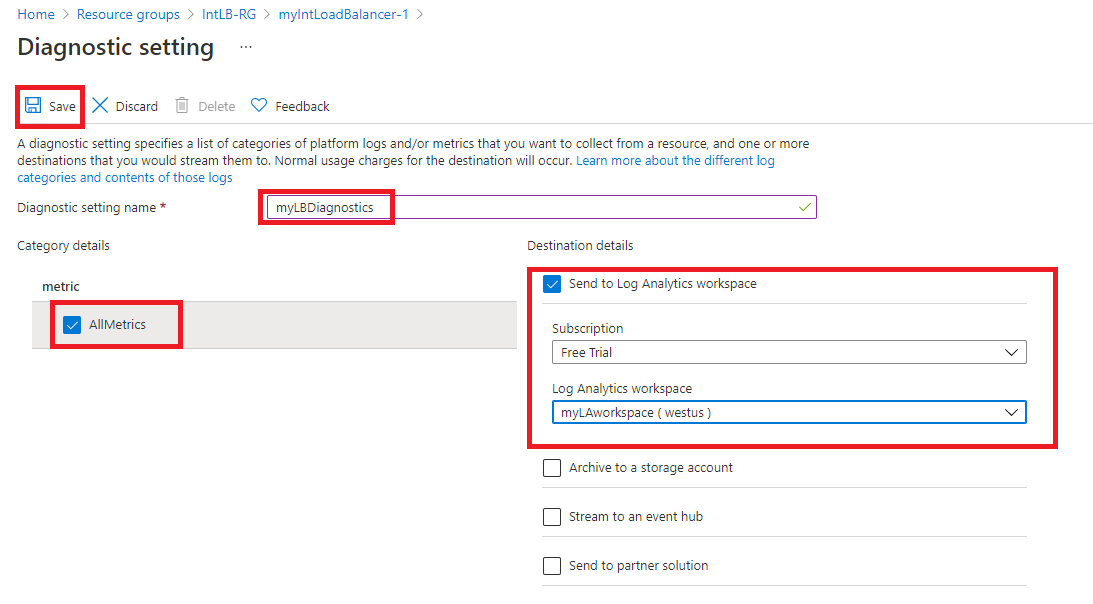
On the Diagnostic setting page, in the name box, enter myLBDiagnostics.
-
Select the AllMetrics checkbox, then select the Send to Log Analytics workspace checkbox.
-
Select your subscription from the list, then select myLAworkspace (westus) from the workspace drop-down list.
-
Select Save.
Clean up resources
Note: Remember to remove any newly created Azure resources that you no longer use. Removing unused resources ensures you will not see unexpected charges.
-
On the Azure portal, open the PowerShell session within the Cloud Shell pane.
-
Delete all resource groups you created throughout the labs of this module by running the following command:
Remove-AzResourceGroup -Name 'IntLB-RG' -Force -AsJob
Note: The command executes asynchronously (as determined by the -AsJob parameter), so while you will be able to run another PowerShell command immediately afterwards within the same PowerShell session, it will take a few minutes before the resource groups are actually removed.
Extend your learning with Copilot
Copilot can assist you in learning how to use the Azure scripting tools. Copilot can also assist in areas not covered in the lab or where you need more information. Open an Edge browser and choose Copilot (top right) or navigate to copilot.microsoft.com. Take a few minutes to try these prompts.
- Summarize the Azure tools that are available for monitoring virtual networks.
- What Azure Network Watcher monitoring tools are available?
Learn more with self-paced training
- Introduction to Azure Monitor. In this module, you learn how to use Azure Monitor to provide insights into your Azure resource performance and operations.
Key takeaways
Congratulations on completing the lab. Here are the main takeaways for this lab.
- Azure Monitor provides features and tools for collecting, managing, and analyzing IT data from all of your Azure, other cloud, and on-premises resources.
- Metrics are quantitative measurements that show snapshots of application or resource performance. Metrics are typically numeric values that you can measure over time.
- Logs are textual records of events, actions, and messages that occur in a resource or application.
- Azure Monitor Insights, visualizations, and dashboards can consume and transmit monitoring information about your applications.
- Alerts notify you of critical conditions and can take corrective action. Alert rules can be based on metric or log data.+