Lab 13: Create and configure an Azure web app
Microsoft Azure user interface
Given the dynamic nature of Microsoft cloud tools, you might experience Azure UI changes that occur after the development of this training content. As a result, the lab instructions and lab steps might not align correctly.
Microsoft updates this training course when the community alerts us to needed changes. However, cloud updates occur frequently, so you might encounter UI changes before this training content updates. If this occurs, adapt to the changes, and then work through them in the labs as needed.
Instructions
Before you start
Sign in to the lab environment
Sign in to your Windows 11 virtual machine (VM) by using the following credentials:
- Username:
Admin - Password:
Pa55w.rd
Note: Your instructor will provide instructions to connect to the virtual lab environment.
Review the installed applications
Find the taskbar on your Windows 11 desktop. The taskbar contains the icon for the application that you’ll use in this lab:
- Microsoft Edge
Lab Scenario
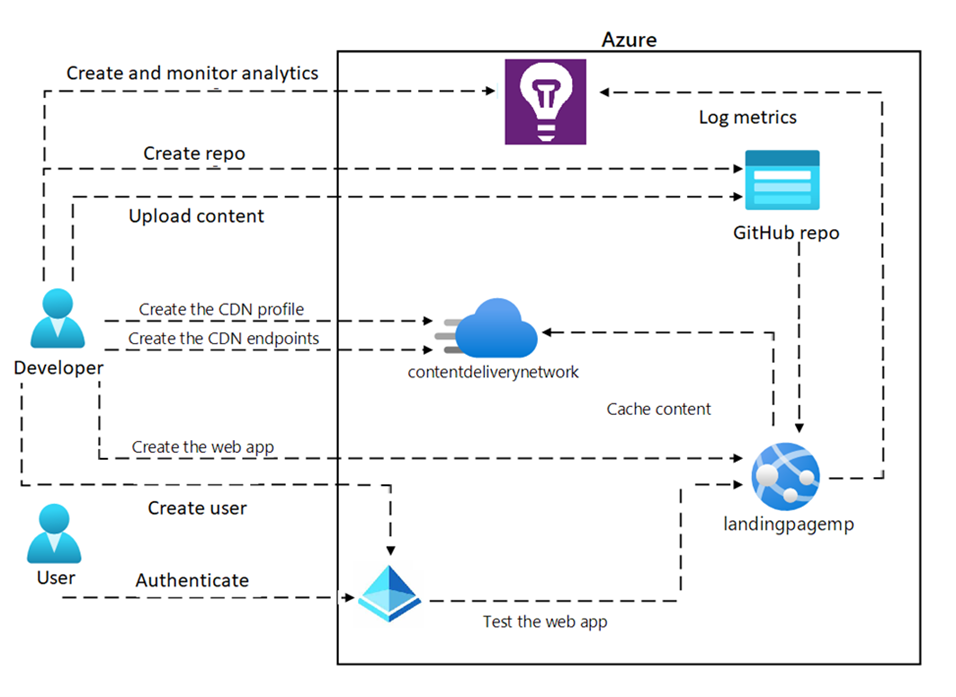
In this lab, you will deploy and configure an Azure Web App that integrates with GitHub. The web app will be a simple implementation of a single-page web app accessible only to internal employees. The website will host content related to company strategies and division sales goals.
To create the web app, you will use the Azure portal and connect it to a GitHub repository. To do this, you will need a free GitHub account, where you will upload the sample website content provided as part of this lab. Once the web app is up and running, you will make changes to the content and watch as the GitHub content is synced to the web app, using the CI/CD methodology.
Because this is an employee-only web app, you will need to secure access to the web app by creating users in Azure AD and implementing security for the web app through user authentication.
Architecture diagram
Exercise 1: Create an Azure App Service Web App
Task 1: Create a GitHub account and upload the sample web app code to a repository
-
On the taskbar, select the Microsoft Edge icon.
-
In the browser window, browse to the GitHub website at
https://github.com/, and create a new account if you don’t already have one. -
Once you’ve logged in, create a new repository by clicking the New button on the main page.
-
Give your repository a name and description, and choose whether it should be public or private.
-
In the Add a README file section, select Add a README file.
-
Select on Create repository to create the repository.
-
In the repository page on GitHub, select the Add file, from drop-down list select Upload Files.
-
Open the File Explorer window, browse to Allfiles (F):\Allfiles\Labs\13\Starter\webapp-sam-lab13, select all files and use the drag and drop feature, to add them to GitHub repository.
-
Add a commit message that describes the changes you made (e.g. “Initial commit of sample web app code”).
-
Select Commit changes to upload the sample web app code to the repository.
Task 2: Create the web app in the Azure portal and connect it to the GitHub account
-
On the taskbar, select the Microsoft Edge icon.
-
In the browser window, browse to the Azure portal at
https://portal.azure.com, and then sign in with the account you’ll be using for this lab. -
In the Azure portal’s navigation pane, select the Create a resource button in the left-hand menu.
-
In the search bar, type Web App and select Web App from the list of options.
-
In the Web App blade, select Create.
-
In the Create Web App blade, select the Basics tab and perform the following actions.
Setting Action Subscription drop-down list Retain the default value Resource group Select Create new, enter wProject-Sam-RG, and then select OK Name Enter webapp-sam[yourname] Publish Select Code Runtime stack Select .NET 8 (LTS) Operating System Select Windows Region Select the East US region Windows Plan (East US) Select Create new and enter ManagedPlan in the Name field, and then select OK Pricing plan Select Standard S1 -
Select the Monitoring tab and select Yes in the Enable Application Insights section. Then select Review + create.
-
Review the options that you selected during the previous steps and then select Create.
Note: Wait for the web app to be created before you continue with this lab.
-
On the Overview blade, select the Go to resource button to navigate to the newly created web app.
Task 3: Deploy Web App from GitHub
-
Open the Azure portal and navigate to the web app that you created in previous task.
-
In the Settings section, select Configuration from the left-hand menu.
-
On the Configuration blade, select General settings.
-
In the General settings tab, select On for Basic Auth Publishing Credentials, select Save and then select Continue.
Note: Wait for a minute to save the configurations.
-
In the Deployment section, select Deployment Center from the left-hand menu.
-
In the Settings tab, select Source from drop-down list select GitHub.
-
Scroll down on the GitHub section and select the Authorize button to allow Azure to access your GitHub account.
-
After successfully authorizing the GitHub access perform the following actions: , and then select Save:
Setting Action Organization drop-down list select your GitHub organization Repository drop-down list select repository that you created in Task 1 Branch drop-down list select branch that you created in Task 1 Note: Wait for a minute to save the configurations.
-
Open the GitHub repository that you created in previous task, select the Actions from the top menu.
-
On the Actions tab, under the All workflows, select the Add or update the Azure App Service build and deployment workflow config to see build and deployment process.
-
After successfully building and deploying, open the Azure portal and navigate to the App Service.
-
On the App Service blade, select Overview and then select Browse.
-
Review and test the web app’s various functions and features to ensure that they work as intended.
Note: Keep the web app browser window open, you will need it later.
Task 4: Make changes to the code in GitHub and verify that the changes are reflected in the web app
-
Open the GitHub repository that contains the code for the web app.
-
In the Pages folder select Index.cshtml file, in the code preview, select Pencil Icon for Editing the file.
-
On the code editor tab for the Index.cshtml file, delete line 9 code in the existing file.
<h1>My Gallery</h1> -
Add the following code:
<h1>Portfolio Gallery</h1> <P>This is a simple .NET web project.</P> -
Select Commit Changes, write a Commit message and Extended description, then select Commit Changes for the Index.cshtml file.
Note: Wait for the changes to be reflected in the web app. This may take a few minutes to an hour, depending on the deployment process.
-
Open the web app browser window, and refresh the browser window to see the changes.
-
Verify that the changes are visible.
-
Test the functionality affected by the changes to ensure that everything is working as expected.
-
If the changes are not reflected in the web app, check the deployment logs and troubleshoot as needed.
-
If the changes are still not visible, contact your trainer for assistance.
Note: Remember to always test changes before committing them to the repository and deploying them to the web app. Additionally, it’s important to follow best practices for version control and collaboration when working with code in GitHub.
Review
This exercise is about creating a web app in the Azure portal and connecting it to a GitHub repository.
Exercise 2: Enable autoscale for the web app
Task 1: Enable custom scaling
-
Open the Azure portal and navigate to the App Service, select the web app you created in the previous exercise.
-
On the Web App blade, select Scale out (App Service plan) from the Settings section.
-
On the Scale out (App Service plan) page, select Rules Based under Scale out method.
-
At the bottom of page, after alert message Rule based scaling will be ignored if Automatic scaling is enabled. Select Manage rules based scaling link.
-
On the Autoscale setting page, enter the following information, and then select Save:
Setting Information Configure Select Custom autoscale Scale mode Select Scale based on a metric Rules Select Add a rule link, on the Scale rule blade, retain default values for all settings, and then select Add Minimum text box in the Instance limits section Enter 1 Maximum text box in the Instance limits section Enter 4 Default text box in the Instance limits section Enter 2 Note: Wait for the save operation to complete before you continue with this lab.
Task 2: Configure scale-out options based on CPU usage to increase the instance count
-
On the Autoscale setting page, scroll down and select + Add a rule.
-
On the Scale rule page, perform the following actions and then select Add and then select Save:
Setting Action Metric name drop-down list Select CPU Percentage Operator drop-down list Select Greater than Metric threshold to trigger scale action text box Enter 60 Duration (minutes) text box Enter 5 Operation drop-down list Select Increase count by Cool down (minutes) text box Enter 5 instance count text box Enter 1 -
Test the rule by generating traffic that reaches the CPU threshold you set.
-
Verify that the auto scaling group scales out as expected.
Note: Similar steps can be followed to configure scale-in options based on CPU usage to decrease the instance count
Task 3: Configure scale-in options based on CPU usage to decrease the instance count
-
On the Autoscale setting page, scroll down and select on + Add a rule.
-
On the Scale rule page, perform the following actions, select Add and then select Save:
Setting Action Metric name drop-down list Select CPU Percentage Operator drop-down list Select Less than Metric threshold to trigger scale action text box Enter 40 Duration (minutes) text box Enter 5 Operation drop-down list Select Decrease count by Cool down (minutes) text box Enter 3 instance count text box Enter 1 -
Test the rule by generating traffic that reaches the CPU threshold you set.
-
Verify that the auto scaling group scales in as expected.
Note: Similar steps can be followed to configure scale-out options based on other metrics, such as memory usage or HTTP queue length.
Task 4: Create an Azure Load Testing
-
In the Azure portal, use the Search resources, services, and docs text box to search for Azure Load Testing and then in the list of results, select Azure Load Testing.
-
On the Azure Load Testing blade, select + Create.
-
On the Create a load testing resource blade, perform the following actions, and then select Review + Create:
Setting Action Subscription list Retain defaults Resource group drop-down list Select WebProject-Sam-RG in the list Name text box Enter loadtest-sam[yourname] Region drop-down list Select an Azure region that you want to test your web app -
Select Create to create the Azure load testing.
Note: Wait for the Azure load testing to be created before you continue with this lab.
-
On the Overview blade, select the Go to resource button to navigate to the blade of the newly created Azure load testing.
Task 5: Quick test and analyze the performance metrics of web app
-
On the new created Azure Load Testing blade, in the Tests section, select the Tests.
-
Select + Create, from drop-down list, select Create a URL-based test.
-
On the Create a URL-based test blade, perform the following actions, and then select Run test:
Setting Action Test URL text box Enter your web app URL that you created in this lab Specify load section Select Virtual users in the list Number of virtual users text box Enter 100 Test duration (minutes) text box Enter 3 Ramp-up time (minutes) text box Enter 0 Note: Wait about 3 minutes to finish the Azure load testing.
-
Once the load test is complete, analyze the performance metrics and identify any performance bottlenecks.
-
Select the Load test results, review the Statistics and Client-side metrics of your web app.
-
Select the Engine health, review the Load engine health metrics of your web app.
-
To download the load testing results, select the Download, from drop-down list, select the Results.
In this task, you created an Azure Load Testing web app and performed load testing on a target web application. You configured settings, monitored performance metrics, and analyzed results to identify performance bottlenecks.
Review
In this exercise, you learned how to enable custom scaling for a web app by configuring rules based on CPU usage. You also performed load testing using Azure Load Testing and analyzed performance metrics to identify and address performance bottlenecks. This exercise provided hands-on experience in optimizing scalability and ensuring optimal performance for web applications.
Exercise 3: Configure user authentication and authorization
Task 1: Configure authentication for the web app
-
Open the Azure portal and navigate to the web app that you want to configure for authentication.
-
On the Settings section, select Authentication from the left-hand menu.
-
On the Authentication pane, select Add identity provider.
-
On the Add an identity provider page, perform the following actions, and then select Add:
Setting Action Identity provider drop-down list Select Microsoft Tenant type section Select Workforce App registration type section Select Create new app registration Name text box Enter Web app name Supported account types section Select Current tenant - Single tenant Restrict access section Select Require authentication Unauthenticated requests section Select HTTP 302 Found redirect: recommended for websites -
Once you have configured your authentication provider, you can configure the specific authentication settings for your web application. This includes things like which users or groups are allowed to access your application, how users should be authenticated (e.g. via a sign-in page or a pop-up window), and what kind of access controls should be in place.
-
Open the web app browser window, and refresh the browser window. You should be prompted to log in via Microsoft authentication provider, and once you have done so you should be able to access your application as normal.
That’s it! With these steps, you should be able to set up authentication for your Azure web application and ensure that only authorized users are able to access it.
Task 2: View activities in Sign-In Logs
-
Open the Azure portal and navigate to the Microsoft Entra ID.
-
On the Microsoft Entra ID page, select Enterprise applications from the left-hand menu.
-
On the **Enterprise applications All applications** page, search and select your web app. -
On the Activity section, select Sign-in logs from the left-hand menu.
-
You can filter the sign-in logs based on specific criteria, such as the user’s name, the application they accessed, or the date and time of the sign-in.
-
You can also export the sign-in logs to a CSV file for further analysis or reporting.
Note: Wait for a few minutes to see recent sign-in logs.
That’s it! With these steps, you should be able to configure Sign-In Logs for your Azure Web Service and ensure that your application is secure and compliant with your organization’s policies.
Review
This exercise is about configuring user authentication and sign-in logs for a web app.
Exercise 4: Application Insights for Web App
Task 1: View the application’s performance through Application Insights
-
Open the Azure portal and navigate to the App Service, select the web app you created in the previous exercise.
-
On the Web App blade, select Application Insights from the Settings section.
-
Select View Application Insights data.
-
You should see a dashboard with several performance metrics for your application, including response times, server response times, and page views.
-
To view more detailed information about a specific metric, select it to open the corresponding chart.
-
From here, you can adjust the time range and granularity of the chart to view the data you’re interested in.
-
You can also use the Filter option to narrow down the data based on specific criteria.
-
If you notice any performance issues, you can use the Investigate option to drill down into the data and identify the root cause of the issue.
-
Additionally, you can use the Alerts feature to set up alerts for specific performance metrics, so you can be notified if they fall outside of acceptable ranges.
Congratulations, you have now successfully viewed your application’s performance through Application Insights! You can now move on to configuring custom telemetry in Task 3.
Task 2: Query the web performance metrics in Log Analytics
-
On the Application Insights blade, select Logs under the Monitoring section.
-
This will open the Log Analytics workspace for your Application Insights resource.
-
In the query editor, enter the following query to retrieve web performance metrics:
requests
| where timestamp > ago(24h)
| summarize count() by bin(timestamp, 1h), resultCode
-
This query retrieves the number of requests and the HTTP status code for each hour over the last 24 hours. You can modify the time range and granularity of the query as needed.
-
Select Run to execute the query. The results will be displayed in a table below the query editor.
-
You can also visualize the query results by clicking on the Chart button in the query editor. This will open a chart that displays the data in a more visual format.
-
If you want to save the query for future use, select the Save button and give the query a name and description.
Congratulations, you have now successfully queried web performance metrics in Log Analytics! You can now move on to creating custom telemetry in Task 4.
Task 3: View the Application Map in Azure Web App
-
On the Application Insights blade, select Application Map from the Investigate section.
-
On the Application Map blade, select the circle from the center of Application Map page.
-
From the Application Map, you can explore various aspects of your application, such as the overall health, performance, and dependencies between different components.
-
You can drill down into specific components by clicking on them in the map, allowing you to analyze individual dependencies and performance metrics.
That’s it! You have successfully set up Application Insights and accessed the Application Map for your Azure Web App.
Task 4: Set up the Availability feature in Application Insights for a web app
-
On the Application Insights blade, select Availability from the Investigate section.
-
On the Availability blade, select Add Standard test to create a new availability test.
-
On the Create Standard test page, perform the following actions, and then select Create:
Setting Action Test name text box Enter standardTest URL text box Enter web app url Test frequency drop-down list Select 5 minutes Test locations drop-down list Select location where the test will be executed from -
The availability test will now run according to the specified frequency, and you can monitor the results in the Availability section of your Application Insights resource.
Note: Wait 5 to 10 minutes to see the test result.
-
From the Availability section, you can view the test results, set up alerts, and analyze the availability and performance of your web app.
That’s it! You have successfully set up the Availability feature in Application Insights for your web app in Azure.
Review
This exercise is all about enabling and utilizing the Application Insights service in Azure to monitor and diagnose issues in a web app.
Exercise 5: Enable caching for the web app
Task 1: Create a CDN profile
-
On the Azure portal’s navigation pane, select Create a resource.
-
On the Create a resource blade, in the Search services and marketplace text box, enter CDN, and then select Enter.
-
On the Marketplace search results blade, select the Front Door and CDN profiles result, and then select Create.
-
On the Compare offerings page, select Explore other offerings and then select Azure CDN Standard from Microsoft (classic), and then select Continue.
-
On the CDN profile blade, on the Basics tab, perform the following actions, and then select Review + create:
Setting Action Subscription drop-down list Retain the default value Resource group drop-down list Select wProject-Sam-RG in the list Name text box Enter contentdeliverynetwork Region text box Retain the default value (Global) Pricing tier drop-down list Select Microsoft CDN (classic) Create a new CDN endpoint check box Not selected -
On the Review + create tab, review the options that you selected during the previous steps.
-
Select Create to create the CDN profile by using your specified configuration.
Note: Wait for Azure to finish creating the CDN profile before you move forward with the lab. You’ll receive a notification when the app is created.
-
On the Overview blade, select the Go to resource button to navigate to the blade of the newly created CDN profile.
-
On the CDN profile blade, select + Endpoint.
-
In the Add an endpoint pop-up dialog box, perform the following actions, and then select Add:
Setting Action Name text box Enter cdn-web-sam[yourname] Origin type drop-down list Select Web App Origin hostname drop-down list Select the webapp-sam[yourname].azurewebsites.net option for the web app that you created previously in this lab Origin path text box Retain the default value Origin host header text box Retain the default value Protocol and Origin port sections Retain the default values Optimized for drop-down list Select General web delivery
Congratulations, you have now successfully created a CDN profile and a CDN endpoint.
Task 2: Enable caching on the web app endpoint
-
On the Front Door and CDN profile blade, select cdn-web-sam[yourname]** endpoints that you created before.
-
On the CDN endpoint blade, select Caching rules under the Settings section.
-
On the Caching rules blade, perform the following actions:
Setting Action Query string caching behaviore drop-down list Select Cache every unique URL -
Select Save button.
Congratulations, you have now successfully enabled caching on your web app endpoint! The CDN will now cache the specified files or paths, which can improve the performance and scalability of your web app.
Review
This exercise is all about enabling caching for a web app using Azure CDN. By completing the tasks, you’ll gain practical experience in registering a CDN provider, creating a CDN profile, and configuring caching rules.