Lab 11: Monitor services that are deployed to Azure
Microsoft Azure user interface
Given the dynamic nature of Microsoft cloud tools, you might experience Azure UI changes that occur after the development of this training content. As a result, the lab instructions and lab steps might not align correctly.
Microsoft updates this training course when the community alerts us to needed changes. However, cloud updates occur frequently, so you might encounter UI changes before this training content updates. If this occurs, adapt to the changes, and then work through them in the labs as needed.
Instructions
Before you start
Sign in to the lab environment
Sign in to your Windows 11 virtual machine (VM) by using the following credentials:
- Username:
Admin - Password:
Pa55w.rd
Note: Your instructor will provide instructions to connect to the virtual lab environment.
Review the installed applications
Find the taskbar on your Windows 11 desktop. The taskbar contains the icons for the applications that you’ll use in this lab, including:
- Microsoft Edge
- File Explorer
- Visual Studio Code
- Azure PowerShell
Lab Scenario
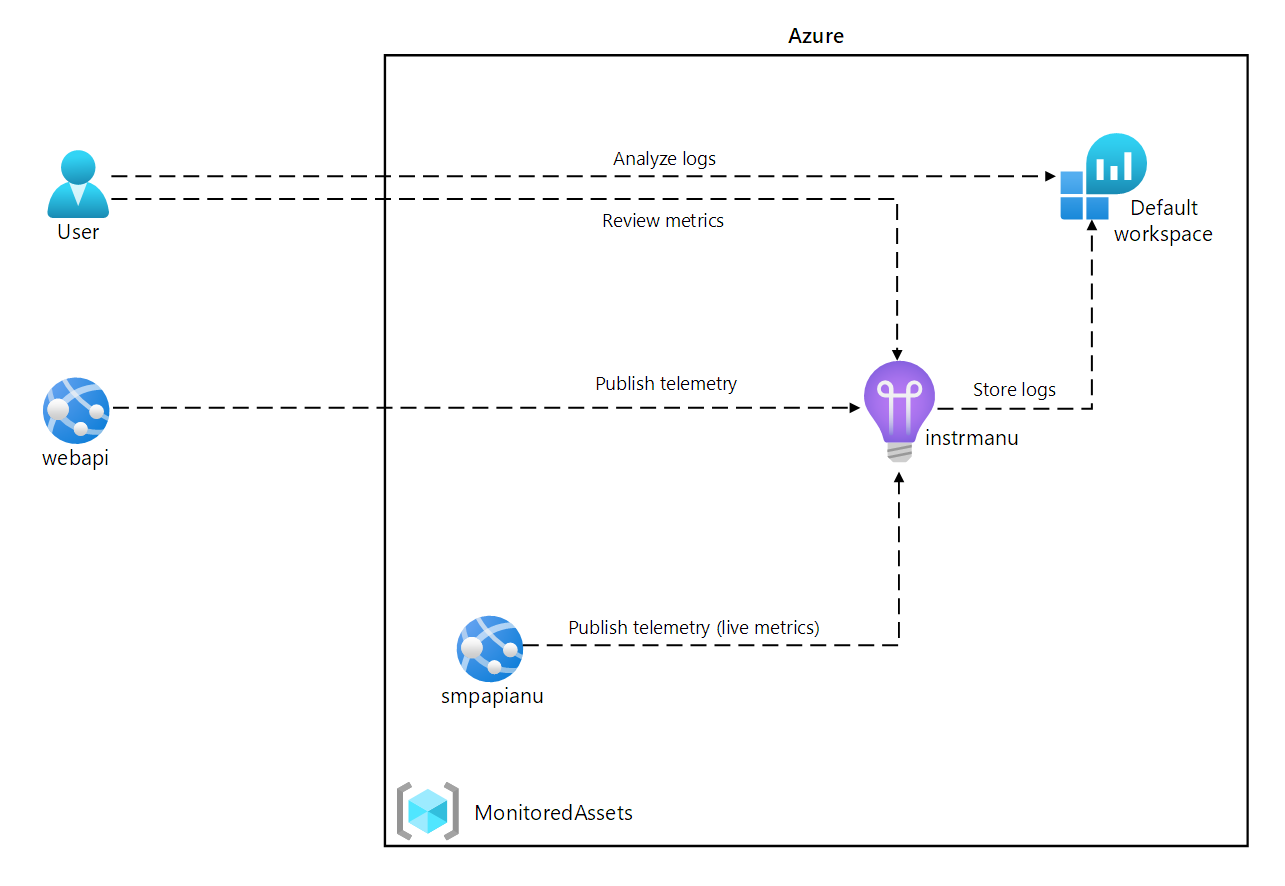
In this lab, you will create an Application Insights resource in Azure that will be used to monitor and log application insight data for later review. The API will be set to automatically scale if demand increases to a certain threshold and logging the data will help determine how the service is being utilized.
Architecture diagram
Exercise 1: Create and configure Azure resources
Task 1: Open the Azure portal
-
On the taskbar, select the Microsoft Edge icon.
-
In the browser window, browse to the Azure portal at
https://portal.azure.com, and then sign in with the account you’ll be using for this lab.Note: If this is your first time signing in to the Azure portal, you’ll be offered a tour of the portal. Select Get Started to skip the tour and begin using the portal.
Task 2: Create an Application Insights resource
-
In the Azure portal, use the Search resources, services, and docs text box at the top of the page to search for Application Insights and then, in the list of results, select Application Insights.
-
On the Application Insights blade, select + Create.
-
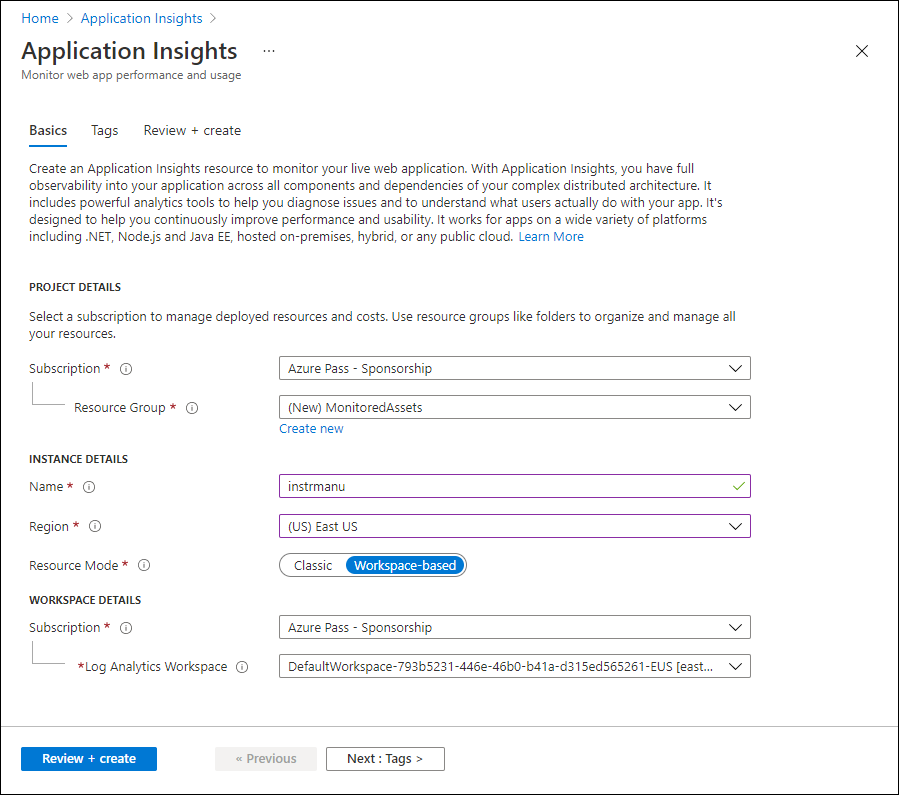
On the Application Insights blade, on the Basics tab, perform the following actions, and select Review + create:
Setting Action Subscription drop-down list Retain the default value Resource group section Select Create new, enter MonitoredAssets, and then select OK Name text box instrm[yourname] Region drop-down list Select any Azure region in which you can deploy an Application Insights resource WORKSPACE DETAILS section Retain the default values for the Subscription and Log Analytics Workspace drop-down lists The following screenshot displays the configured settings on the Application Insights blade.
-
On the Review + create tab, review the options that you selected during the previous steps.
-
Select Create to create the Application Insights instance by using your specified configuration.
Note: Wait for the creation task to complete before you proceed with this lab.
-
On the Microsoft.AppInsights | Overview blade, select the Go to resource button to navigate to the blade of the newly created Application Insights resource.
-
On the Application Insights blade, in the Configure section, select the Properties link.
-
On the Properties blade, next to the Instrumentation Key entry, select the Copy to clipboard button, and then record the copied value. You’ll use it later in this lab.
Note: The key is used by client applications to connect to a specific Application Insights resource.
Task 3: Create an Azure Web API resource
-
In the Azure portal, use the Search resources, services, and docs text box at the top of the page to search for App Services and then, in the list of results, select App Services.
-
On the App Services blade, select + Create, and then select + Web App.
-
On the Create Web App blade, on the Basics tab, perform the following actions, and then select the Monitor + secure tab:
Setting Action Subscription drop-down list Retain the default value Resource group drop-down list Select MonitoredAssets Name text box Enter smpapi[yourname] Publish section Select Code Runtime stack drop-down list Select .NET 8 (LTS) Operating System section Select Windows Region drop-down list Select the same region you chose as the location of the Application Insights resource Windows Plan (East US) section Select Create new, in the Name text box, enter MonitoredPlan, and then select OK Pricing plan section Retain the default value -
On the Monitor + secure tab, perform the following actions, and then select Review + create:
Setting Action Enable Application Insights section Ensure that Yes is selected Application Insights drop-down list Select the instrm[yourname] Application Insights resource that you created previously in this lab -
On the Create Web App tab, review the options that you selected during the previous steps.
-
Select Create to create the web API by using your specified configuration.
Note: Wait for the creation task to complete before you proceed with this lab.
-
On the deployment Overview blade, select the Go to resource button to navigate to the blade of the newly created Azure web API.
-
On the App Service blade, in the Settings section, select the Environment Variables link.
-
In the Environment Variables section, perform the following actions:
a. On the App settings tab, select Show values to display secrets associated with your web API.
b. Note the value representing the APPLICATIONINSIGHTS_CONNECTION_STRING key. This value was set automatically when you built the web API resource.
-
On the App Service blade, select Overview at the top of the service menu.
-
On the App Service blade, in the Essentials section, record the value of the Default domain link. You’ll use this value later in the lab to submit requests to the web API.
Task 4: Configure web API autoscale options
-
On the App Service blade, in the Settings section, select the Scale out (App Service Plan) link.
-
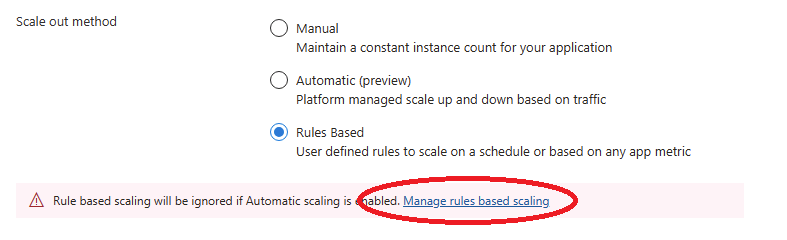
Scroll down until you see the Scale out method. Select the Rules Based option, then select Configure.
-
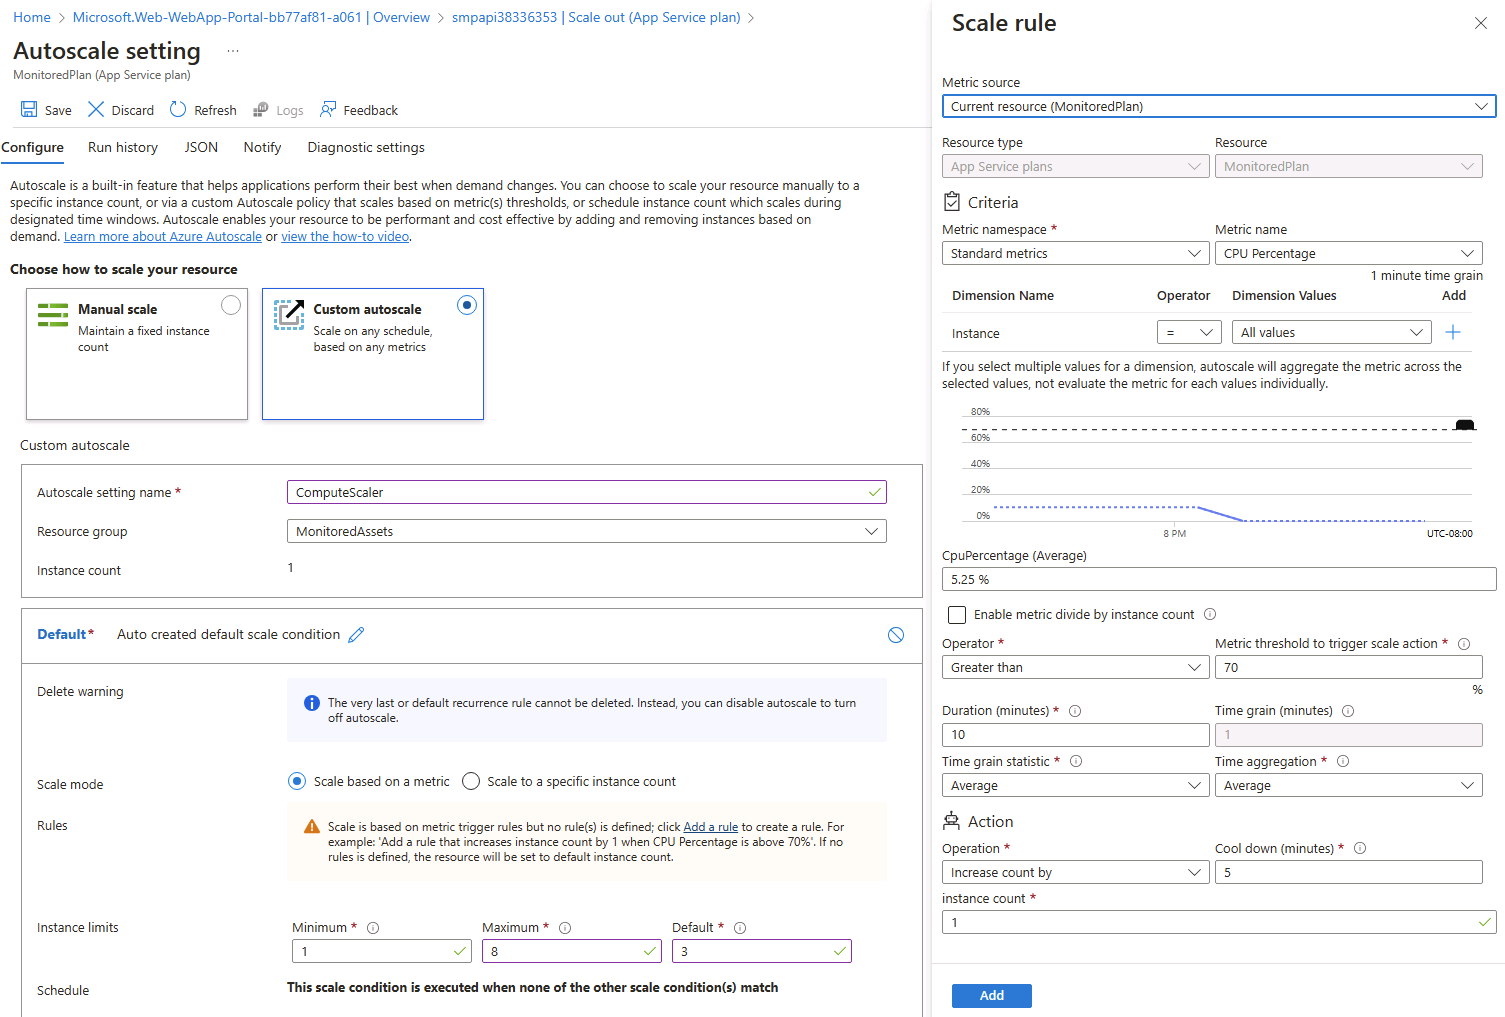
In the Scale out section, perform the following actions, and then select Save:
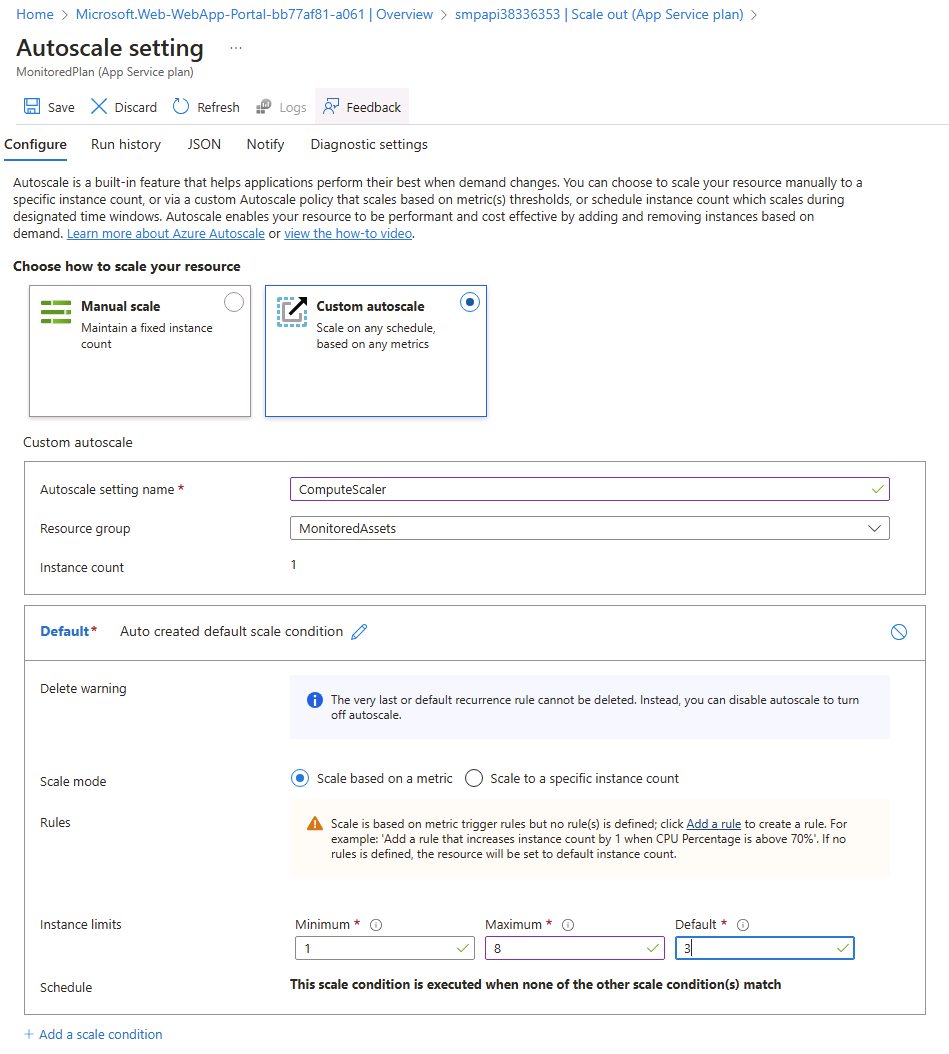
Setting Action Scale out section Select Custom autoscale Autoscale setting name text box Enter ComputeScaler Resource group drop-down list Select MonitoredAssets Scale mode section Select Scale based on a metric Minimum text box in the Instance limits section Enter 1 Maximum text box in the Instance limits section Enter 8 Default text box in the Instance limits section Enter 3 The following screenshot displays the configured settings in the Scale out section on the App Service blade.
Setting Action Rules section Select Add a rule Scale rule blade Retain default values for all settings, and then select Add The following screenshot displays additional settings in the Scale out section on the App Service blade.
Note: Wait for the save operation to complete before you continue with this lab.
Review
In this exercise, you created the Azure resources that you’ll use for the remainder of the lab.
Exercise 2: Monitor a local web API by using Application Insights
Task 1: Build a .NET Web API project
-
From the lab computer, start Visual Studio Code.
-
In Visual Studio Code, on the File menu, select Open Folder.
-
In the Open Folder window, browse to Allfiles (F):\Allfiles\Labs\11\Starter\Api, and then select Select Folder.
-
In the Visual Studio Code window, on the Menu Bar, select Terminal and then select New Terminal*.
-
At the terminal prompt, run the following command to create a new .NET Web API application named SimpleApi in the current directory:
dotnet new webapi --output . --name SimpleApi --framework net8.0 -
Run the following command to import version 2.21.0 of Microsoft.ApplicationInsights from NuGet to the current project:
dotnet add package Microsoft.ApplicationInsights --version 2.21.0Note: The dotnet add package command will add the Microsoft.ApplicationInsights package from NuGet. For more information, refer to Microsoft.ApplicationInsights.
-
Run the following command to import version 2.21.0 of Microsoft.ApplicationInsights.AspNetCore from NuGet:
dotnet add package Microsoft.ApplicationInsights.AspNetCore --version 2.21.0Note: The dotnet add package command will add the Microsoft.ApplicationInsights.AspNetCore package from NuGet. For more information, refer to Microsoft.ApplicationInsights.AspNetCore.
-
At the terminal prompt, run the following command to import version 2.21.0 of Microsoft.ApplicationInsights.PerfCounterCollector from NuGet to the current project:
dotnet add package Microsoft.ApplicationInsights.PerfCounterCollector --version 2.21.0Note: The dotnet add package command will add the Microsoft.ApplicationInsights.PerfCounterCollector package from NuGet. For more information, refer to Microsoft.ApplicationInsights.PerfCounterCollector.
-
At the terminal prompt, run the following command to import version 2.4.0 of Microsoft.ApplicationInsights.Profiler.AspNetCore from NuGet to the current project:
dotnet add package Microsoft.ApplicationInsights.Profiler.AspNetCore --version 2.4.0Note: The dotnet add package command will add the Microsoft.ApplicationInsights.Profiler.AspNetCore package from NuGet. For more information, refer to Microsoft.ApplicationInsights.Profiler.AspNetCore.
-
At the terminal prompt, run the following command to build the .NET Web API:
dotnet build
Task 2: Update app code to disable HTTPS and use Application Insights
-
In the Visual Studio Code window, on the Explorer pane, select the Program.cs file to open the file on the editor pane.
-
On the editor pane, locate and delete the following code in line 17:
app.UseHttpsRedirection();Note: This line of code forces the web API to use HTTPS. For this lab, this is unnecessary.
-
In the Program.cs file, add the following two lines starting with line 7 to enable Profiler by registering it along with Application Insights into the Service collection:
builder.Services.AddApplicationInsightsTelemetry(); builder.Services.AddServiceProfiler(); -
Save the changes and close the Program.cs file.
-
In the Visual Studio Code window, on the Explorer pane, select the appsettings.json file to open the file on the editor pane.
-
Add to the appsettings.json file the following element right after the Logging element, replacing the
instrumentation-keyplaceholder with the value of the Application Insights resource instrumentation key that you recorded earlier in this lab:"ApplicationInsights": { "InstrumentationKey": "instrumentation-key" },Note: If the section you are adding is the last element of the file, remove the trailing comma.
-
Your appsettings.json file should now look similar in structure to the following:
 {
     "Logging":{
         "LogLevel": {
             "Default": "Information",
             "Microsoft.AspNetCore": "Warning"
         }
     },
    "ApplicationInsights":
    {
       "InstrumentationKey": "instrumentation-key"
    },
    "AllowedHosts": "*"
 }
Note Ensure you have replaced the placeholder with your own instrumentation key that you recorded earlier.
-
Save the changes to the appsettings.json file and close it.
-
At the terminal prompt, run the following command to build the .NET Web API.
dotnet publish -c Release -r win-x86 --self-contained -p:PublishReadyToRun=true .\SimpleApi.csproj
Task 3: Test an API application locally
-
At the terminal prompt, run the following command to launch the .NET Web API.
dotnet run -
Review the output of the command and note the HTTP URL that the site is listening on.
-
From the taskbar, open the context menu for the Microsoft Edge icon, and then open a new browser window.
-
In the browser window that opens, navigate to the
http://localhostURL and add the /weatherforecast relative path of your web API.Note: The full URL is
http://localhost:[port-number]/weatherforecast, where the[port-number]placeholder identifies the port number at which the web app is accessible via the HTTP protocol.Note: The page should contain an output in the following format. The actual values will be different.
[ { "date": "2023-10-29", "temperatureC": -8, "summary": "Sweltering", "temperatureF": 18 }, { "date": "2023-10-30", "temperatureC": -12, "summary": "Hot", "temperatureF": 11 }, { "date": "2023-10-31", "temperatureC": 50, "summary": "Chilly", "temperatureF": 121 }, { "date": "2023-11-01", "temperatureC": 51, "summary": "Chilly", "temperatureF": 123 }, { "date": "2023-11-02", "temperatureC": 29, "summary": "Balmy", "temperatureF": 84 } ] -
Refresh the browser page a number of times to simulate some responses.
-
Close the browser window that’s displaying the page generated by
http://localhost:[port-number]/weatherforecast. -
In Visual Studio Code, select Kill Terminal (the Recycle Bin icon) to close the terminal pane and any associated processes.
Task 4: Review metrics in Application Insights
-
On your lab computer, switch to the Microsoft Edge browser window displaying the Azure portal.
-
In the Azure portal, navigate back to the blade of the instrm[yourname] Application Insights resource you created previously in this lab.
-
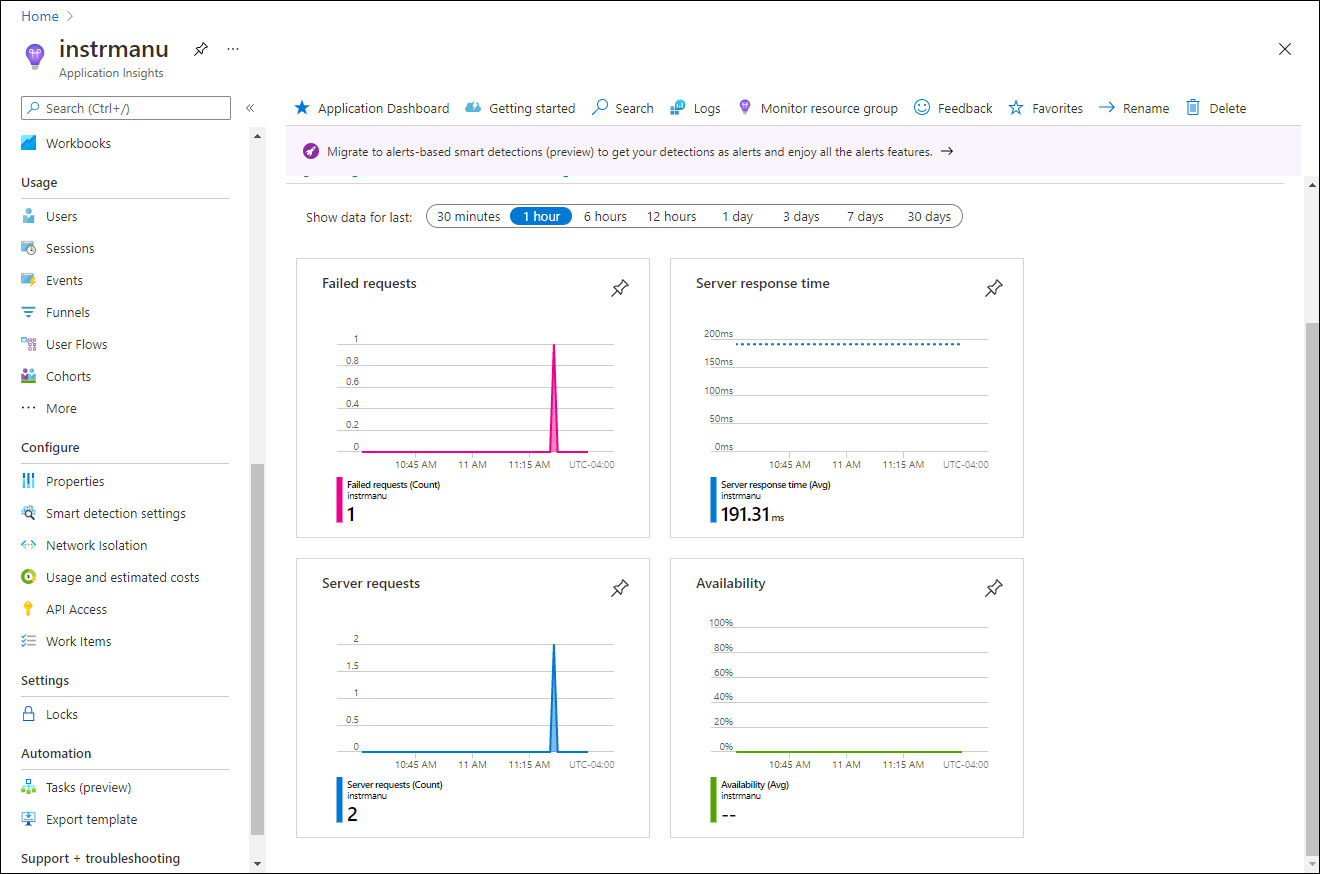
On the Application Insights blade, in the tiles in the center of the blade, find the displayed metrics. Specifically, find the number of server requests that have occurred and the average server response time.
The following screenshot displays the Application Insights metrics of the local web app.
Note: It can take up to five minutes to observe requests in the Application Insights metrics charts.
Review
In this exercise, you created an API app by using ASP.NET and configured it to stream application metrics to Application Insights. You then used the Application Insights dashboard to review performance details about your API.
Exercise 3: Monitor a web API using Application Insights
Task 1: Deploy an application to the web API
-
On the lab computer, switch to the Visual Studio Code.
-
In the Visual Studio Code window, on the Menu Bar, select Terminal and then select New Terminal.
-
At the terminal prompt, run the following command to ensure that the current directory is set to the Allfiles (F):\Allfiles\Labs\11\Starter\Api\bin\Release\net8.0\win-x86\publish, where the deployment files reside:
cd F:\Allfiles\Labs\11\Starter\Api\bin\Release\net8.0\win-x86\publish\ -
Run the following command to create a zip file containing the starter project that you’ll deploy next to the Azure web API:
Compress-Archive -Path * -DestinationPath api.zip -
At the terminal prompt, run the following command to sign in to your Azure subscription by using Azure PowerShell:
Connect-AzAccount -
When prompted, authenticate by providing the credentials to access the Azure subscription you are using for this lab.
Note: Wait for the sign-in process to complete.
-
Run the following command to display the listing of all web apps in the MonitoredAssets resource group:
Get-AzWebApp -ResourceGroupName MonitoredAssets -
Run the following command to display the list of web apps in the MonitoredAssets resource group, which names start with smpapi*:
Get-AzWebApp -ResourceGroupName MonitoredAssets | Where-Object {$_.Name -like 'smpapi*'} -
Run the following commands to display the name of the first of the web apps identified in the previous step and store it in a variable named $webAppName:
Get-AzWebApp -ResourceGroupName MonitoredAssets | Where-Object {$_.Name -like 'smpapi*'} | Select-Object -ExpandProperty Name $webAppName = (Get-AzWebApp -ResourceGroupName MonitoredAssets | Where-Object {$_.Name -like 'smpapi*'})[0] | Select-Object -ExpandProperty Name -
Run the following command to deploy the api.zip file you created previously in this task to the web API whose name you identified in the previous step:
Publish-AzWebApp -ResourceGroupName MonitoredAssets -Name $webAppName -ArchivePath "F:\Allfiles\Labs\11\Starter\Api\bin\Release\net8.0\win-x86\publish\api.zip" -forceNote: Wait for the deployment to complete before you continue with this lab.
-
On the lab computer, launch another Microsoft Edge browser window.
-
In the browser window, navigate to the Azure Web API app into which you deployed the API app previously in this task by appending to its URL (that you recorded previously in this lab) the suffix /weatherforecast.
Note: For example, if your URL is
https://smpapianu.azurewebsites.net, the new URL would behttps://smpapianu.azurewebsites.net/weatherforecast. -
Verify that the output resembles the one generated when running the API app locally.
Note: The output will include different values but it should have the same format.
Task 2: Configure in-depth metric collection for Web Apps
-
On your lab computer, switch to the Microsoft Edge browser window displaying the Azure portal.
-
In the Azure portal, navigate back to the blade of the smpapi[yourname] web app resource you created previously in this lab.
-
On the App Service blade, select Application Insights.
-
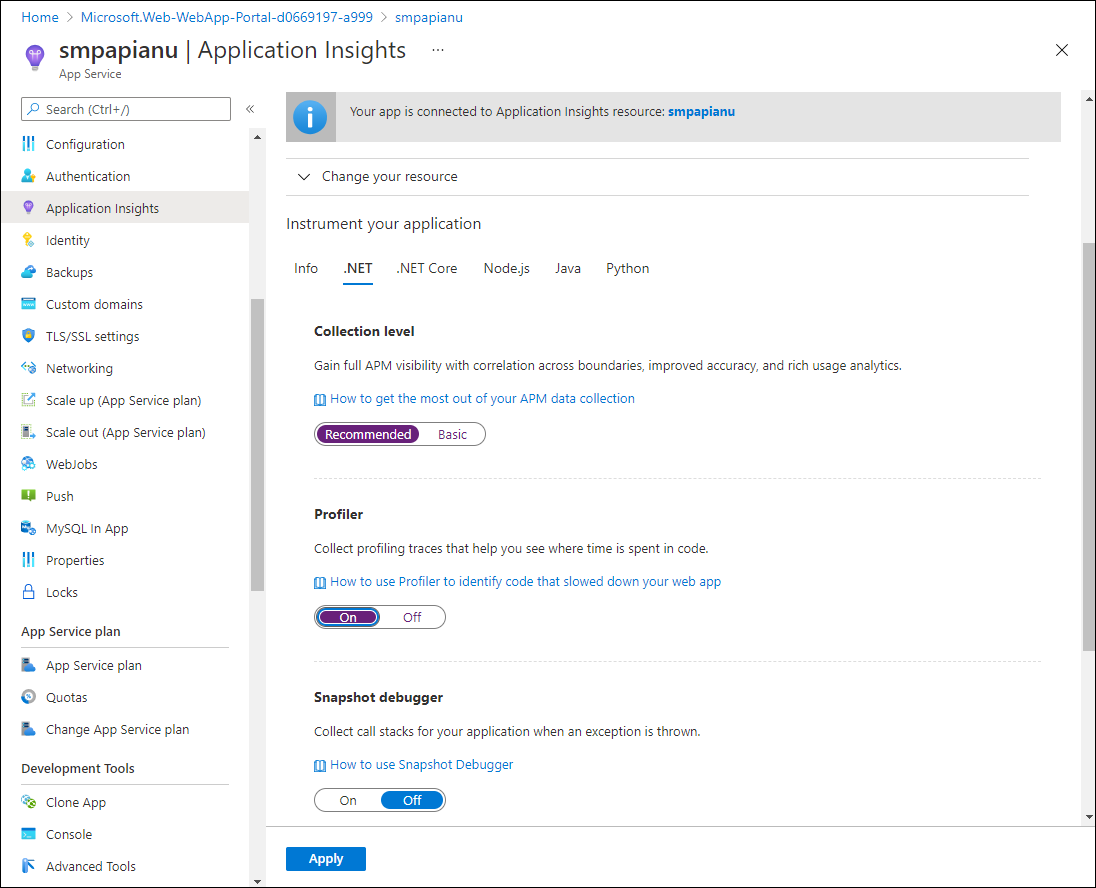
On the Application Insights blade, perform the following actions, select Apply, and then in the confirmation dialog, select Yes:
Setting Action Application Insights slider Ensure it is set to Enable Instrument your application section Select the .NET tab Collection level section Select Recommended Profiler section Select On Snapshot debugger section Select Off SQL Commands section Select Off The following screenshot displays the Application Insights settings of the Azure Web API.
-
Switch to the browser tab you opened in the previous task to display the results of deployment of your API app to the target Azure API app (including the /weatherforecast relative path in the target URL) and refresh the browser page several times.
-
Review the JSON-formatted output generated by the API.
-
Record the URL that you used to access the JSON-formatted output.
Note: The URL should be in the format
https://smpapianu.azurewebsites.net/weatherforecastif smpapianu was the site name you created earlier.
Task 3: Get updated metrics in Application Insights
-
Return to the browser window displaying the Azure web app in the Azure portal.
-
On the Application Insights blade of the web app, select the View Application Insights data link.
-
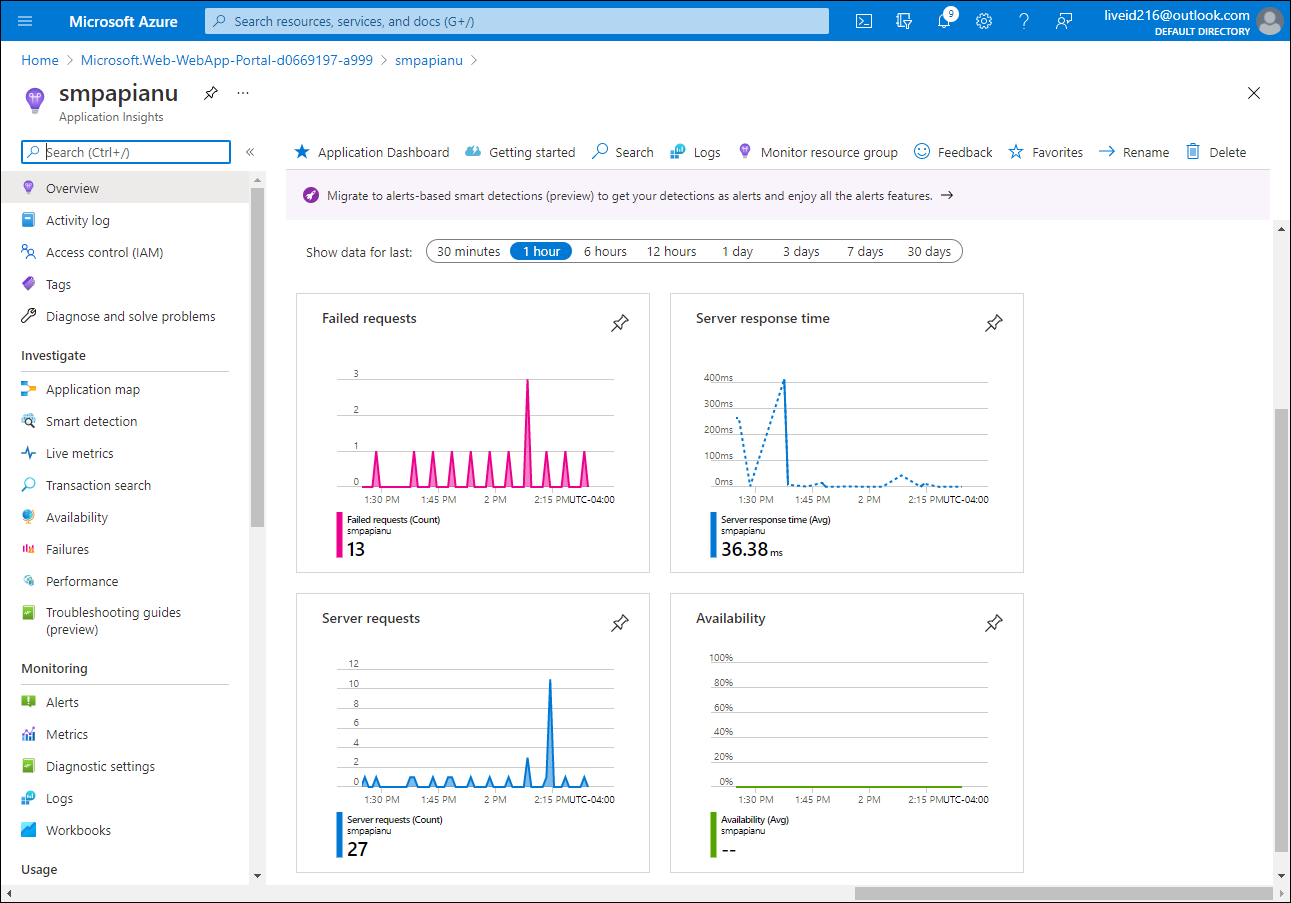
On the Application Insights blade, review the collected metrics in the tiles in the center of the blade, including the number of server requests that have occurred and the average server response time.
The following screenshot displays the Application Insights metrics of the Azure web app in the Azure portal.
Note: It can take up to five minutes for updated metrics to appear in the Application Insights metrics charts.
Task 4: View real-time metrics in Application Insights
-
On the Application Insights blade, in the Investigate section, select Live metrics.
-
Switch back to the browser window displaying the target API app running in the target Azure web app (which targets the /weatherforecast relative path in the target URL), and then refresh the browser page several times.
-
Switch to the browser window displaying the Live metrics blade and review its content.
Note: The Incoming Requests section should update within seconds, showing the requests that you made to the web API.
Review
In this exercise, you configured and tested Application Insights logging of your web API app and viewed live information about the requests being made.