Lab 11 - Implement Monitoring
Lab introduction
In this lab, you learn about Azure Monitor. You learn to create an alert and send it to an action group. You trigger and test the alert and check the activity log.
This lab requires an Azure subscription. Your subscription type may affect the availability of features in this lab. You may change the region, but the steps are written using East US.
Estimated timing: 40 minutes
Lab scenario
Your organization has migrated their infrastructure to Azure. It is important that Administrators are notified of any significant infrastructure changes. You plan to examine the capabilities of Azure Monitor, including Log Analytics.
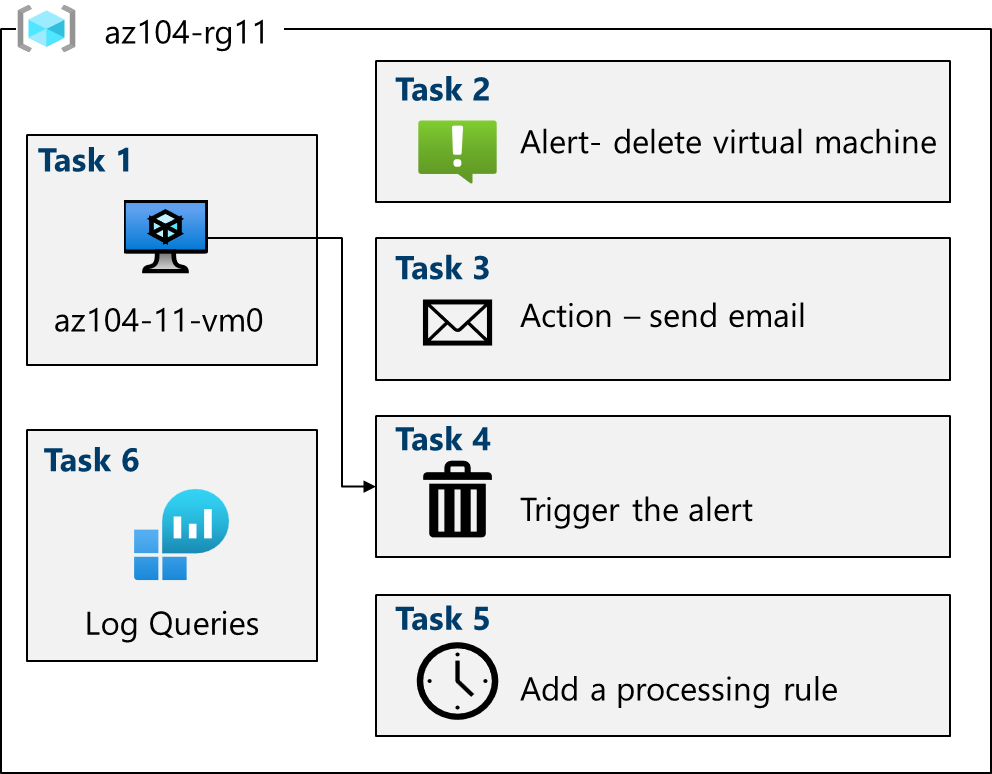
Architecture diagram
Job skills
- Task 1: Use a template to provision an infrastructure.
- Task 2: Create an alert.
- Task 3: Configure action group notifications.
- Task 4: Trigger an alert and confirm it is working.
- Task 5: Configure an alert processing rule.
- Task 6: Use Azure Monitor log queries.
Task 1: Use a template to provision an infrastructure
In this task, you will deploy a virtual machine that will be used to test monitoring scenarios.
-
Download the \Allfiles\Labs\11\az104-11-vm-template.json lab files to your computer.
-
Sign in to the Azure portal -
https://portal.azure.com. -
From the Azure portal, search for and select
Deploy a custom template. -
On the custom deployment page, select Build your own template in the editor.
-
On the edit template page, select Load file.
-
Locate and select the \Allfiles\Labs\11\az104-11-vm-template.json file and select Open.
-
Select Save.
-
Use the following information to complete the custom deployment fields, leaving all other fields with their default values:
Setting Value Subscription Your Azure subscription Resource group az104-rg11(If necessary, select Create new)Region East US (If the deployment fails, change to another region and try again. This is due to quotas in different regions.) Username localadminPassword Provide a complex password -
Select Review + create, then select Create.
-
Wait for the deployment to finish, then click Go to resource group.
-
Review what resources were deployed. There should be one virtual network with one virtual machine.
Configure Azure Monitor for virtual machines (this will be used in the last task)
-
In the portal, search for and select Virtual machines and select az104-vm0. If the VM status shows Stopped, select Start and wait until the status changes to Running.
-
In the portal, search for and select Monitor.
-
Take a minute to review all the insights, detection, triage, and diagnosis tools that are available.
-
Select View in the VM Insights box, and then select Configure Insights.
-
Select Enable next to your virtual machine.
-
Ensure Open Telemetry Metrics is not checked.
-
Select Review + enable, and then Enable.
-
It will take a few minutes for the virtual machine agent to install and onboard.
-
You can proceed to the next task, but continue to monitor the Notifications. If the on-boarding fails, try to enable it again.
Task 2: Create an alert
In this task, you create an alert for when a virtual machine is deleted.
-
Continue on the Monitor page , select Alerts.
-
Select Create + and select Alert rule.
-
Select the box for the subscription, then select Apply. This alert will apply to any virtual machines in the subscription. Alternatively, you could just specify one particular machine.
-
Select the Condition tab and then select the See all signals link.
-
Search for and select Delete Virtual Machine (Virtual Machines). Notice the other built-in signals. Select Apply
-
In the Alert logic area (scroll down), review the Event level selections. Leave the default of All selected.
-
Review the Status selections. Leave the default of All selected.
-
Leave the Create an alert rule pane open for the next task.
Task 3: Configure action group notifications
In this task, if the alert is triggered send an email notification to the operations team.
-
Continue working on your alert. Move to the Actions tab. Under Select actions, select Use action groups, and then select + Create action group.
Did you know? You can add up to five action groups to an alert rule. Action groups are executed concurrently, in no specific order. Multiple alert rules can use the same action group.
-
On the Basics tab, enter the following values for each setting.
Setting Value Project details Subscription your subscription Resource group az104-rg11 Region Global (default) Instance details Action group name Alert the operations team(must be unique in the resource group)Display name AlertOpsTeam -
Select Next: Notifications and enter the following values for each setting.
Setting Value Notification type Select Email/SMS message/Push/Voice Name VM was deleted -
Select Email, and in the Email box, enter your email address, and then select OK.
Note: You should receive an email notification saying you were added to an action group. There may be a few minutes delay, but that is a sure sign the rule has deployed.
-
Select Review + create and then Create.
-
Once the action group is created move to the Next: Details > tab and enter the following values for each setting.
Setting Value Resource group az104-rg11 Alert rule name VM was deletedAlert rule description A VM in your resource group was deleted -
Select Review + create to validate your input, then select Create.
Task 4: Trigger an alert and confirm it is working
In this task, you trigger the alert and confirm a notification is sent.
Note: If you delete the virtual machine before the alert rule deploys, the alert rule might not be triggered.
-
In the portal, search for and select Virtual machines.
-
Check the box for the az104-vm0 virtual machine.
-
Select Delete from the menu bar.
-
In the Delete Resources pane, type
deletein the Enter “delete” to confirm deletion text field, then select Delete. When the secondary Delete confirmation dialog appears, select Delete again to confirm. -
In the title bar, select the Notifications icon and wait until vm0 is successfully deleted.
-
You should receive a notification email that reads, Important notice: Azure Monitor alert VM was deleted was activated… If not, open your email program and look for an email from azure-noreply@microsoft.com.
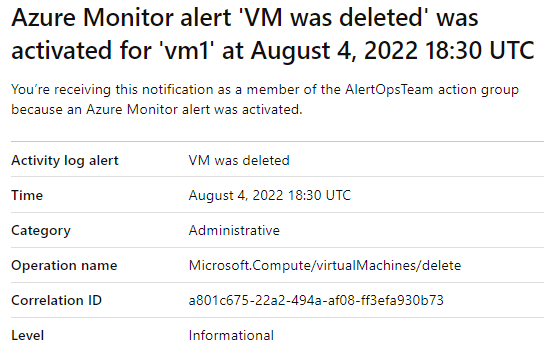
-
On the Azure portal resource menu, select Monitor, and then select Alerts in the menu on the left.
-
You should have three verbose alerts that were generated by deleting vm0.
Note: It can take a few minutes for the alert email to be sent and for the alerts to be updated in the portal. If you don’t want to wait, continue to the next task and then return.
-
Select the name of one of the alerts (For example, VM was deleted). An Alert details pane appears that shows more details about the event.
Task 5: Configure an alert processing rule
In this task, you create an alert rule to suppress notifications during a maintenance period.
-
Continue in the Alerts blade, select Alert processing rules and then + Create.
-
Select your Subscription, then select Apply.
-
Select Next: Rule settings, then select Suppress notifications.
-
Select Next: Scheduling >.
-
By default, the rule works all the time, unless you disable it or configure a schedule. You are going to define a rule to suppress notifications during overnight maintenance. Enter these settings for the scheduling of the alert processing rule:
Setting Value Apply the rule At a specific time Start Enter today’s date at 10 pm. End Enter tomorrow’s date at 7 am. Time zone Select the local timezone. 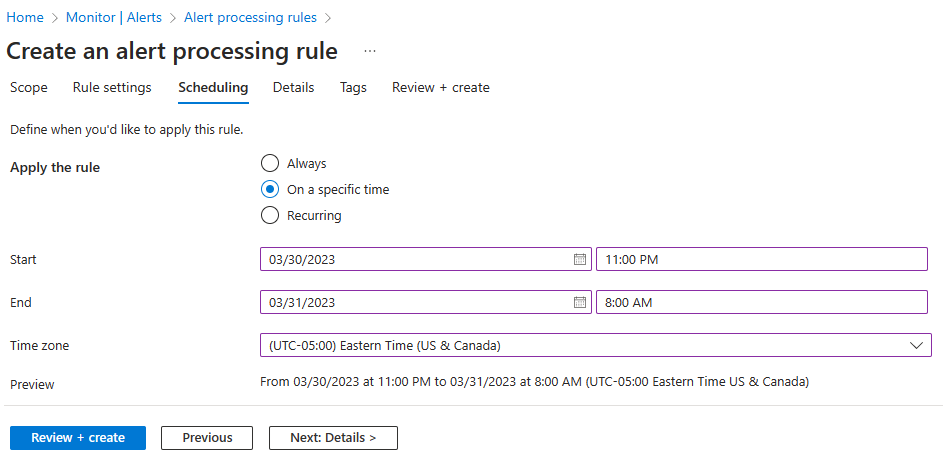
-
Select Next: Details > and enter these settings:
Setting Value Resource group az104-rg11 Rule name Planned MaintenanceDescription Suppress notifications during planned maintenance. -
Select Review + create to validate your input, then select Create.
Task 6: Use Azure Monitor log queries
In this task, you will use Azure Monitor to query the data captured from the virtual machine.
Note: It is okay if data doesn’t appear. Focus on the steps to review monitoring information, including preconfigured and custom log queries.
-
In the Azure portal, search for and select
Monitor, then click Logs. -
If necessary, close the splash screen.
-
If a scope prompt appears, select your Subscription and click Apply. If no scope selector is shown, continue with the default scope.
-
On the right side of the query editor, select the drop-down next to Simple mode and choose KQL mode.

-
In the query editor, enter the following query and click Run.
Heartbeat | summarize Count = count() by Computer -
You should receive a heartbeat count for when the virtual machine was running.
-
Optionally, select Queries hub on the top toolbar to browse sample queries. If a Virtual machines category and Count heartbeats are available, run it for comparison.
-
Replace the query with this one, and then click Run. Review the resulting chart.
 InsightsMetrics
 | where TimeGenerated > ago(1h)
 | where Name == "UtilizationPercentage"
 | summarize avg(Val) by bin(TimeGenerated, 5m), Computer //split up by computer
 | render timechart
Note: If the query does not paste correctly, try pasting into Notepad and then copying and re-pasting into the query field.
-
As you have time, review and run other queries.
Did you know?: If you want to practice with other queries, there is a Log Analytics Demo Environment.
Did you know?: Once you find a query you like, you can create an alert from it.
Cleanup your resources
If you are working with your own subscription take a minute to delete the lab resources. This will ensure resources are freed up and cost is minimized. The easiest way to delete the lab resources is to delete the lab resource group.
-
In the Azure portal, navigate to the az104-rg11 resource group, select Delete the resource group, enter the resource group name to confirm, and then click Delete. When the secondary Delete confirmation dialog appears, click Delete again to complete the deletion.
-
Using Azure PowerShell,
Remove-AzResourceGroup -Name resourceGroupName. -
Using the CLI,
az group delete --name resourceGroupName.
Extend your learning with Copilot
Copilot can assist you in learning how to use the Azure scripting tools. Copilot can also assist in areas not covered in the lab or where you need more information. Open an Edge browser and choose Copilot (top right) or navigate to copilot.microsoft.com. Take a few minutes to try these prompts.
- What are the basic configuration steps to be alerted in Azure when a virtual machine is down?
- How can I be notified when an Azure alert is triggered?
- Construct an Azure Monitor query to provide virtual machine CPU performance information.
Learn more with self-paced training
- Configure alerts and responses. Understand how to configure and manage alerts and responses in order to proactively manage notifications about potential issues before those issues become problems for your users.
- Monitor your Azure virtual machines with Azure Monitor. Monitor your Azure VMs by using Azure Monitor to collect and analyze VM host and client metrics and logs.
Key takeaways
Congratulations on completing the lab. Here are the main takeaways for this lab.
- Alerts help you detect and address issues before users notice there might be a problem with your infrastructure or application.
- You can alert on any metric or log data source in the Azure Monitor data platform.
- An alert rule monitors your data and captures a signal that indicates something is happening on the specified resource.
- An alert is triggered if the conditions of the alert rule are met. Several actions (email, SMS, push, voice) can be triggered.
- Action groups include individuals that should be notified of an alert.