Explore clustering with Azure Machine Learning Designer
Note To complete this lab, you will need an Azure subscription in which you have administrative access.
Create an Azure Machine Learning workspace
-
Sign into the Azure portal using your Microsoft credentials.
- Select + Create a resource, search for Machine Learning, and create a new Azure Machine Learning resource with an Azure Machine Learning plan. Use the following settings:
- Subscription: Your Azure subscription.
- Resource group: Create or select a resource group.
- Workspace name: Enter a unique name for your workspace.
- Region: Select the closest geographical region.
- Storage account: Note the default new storage account that will be created for your workspace.
- Key vault: Note the default new key vault that will be created for your workspace.
- Application insights: Note the default new application insights resource that will be created for your workspace.
- Container registry: None (one will be created automatically the first time you deploy a model to a container)
-
Select Review + create, then select Create. Wait for your workspace to be created (it can take a few minutes), and then go to the deployed resource.
-
Select Launch studio (or open a new browser tab and navigate to https://ml.azure.com, and sign into Azure Machine Learning studio using your Microsoft account).
- In Azure Machine Learning studio, you should see your newly created workspace. If that is not the case, select your Azure directory in the left-hand menu. Then from the new left-hand menu select Workspaces, where all the workspaces associated to your directory are listed, and select the one you created for this exercise.
Note This module is one of many that make use of an Azure Machine Learning workspace, including the other modules in the Microsoft Azure AI Fundamentals: Explore visual tools for machine learning learning path. If you are using your own Azure subscription, you may consider creating the workspace once and reusing it in other modules. Your Azure subscription will be charged a small amount for data storage as long as the Azure Machine Learning workspace exists in your subscription, so we recommend you delete the Azure Machine Learning workspace when it is no longer required.
Create compute
-
In Azure Machine Learning studio, select the ≡ icon (a menu icon that looks like a stack of three lines) at the top left to view the various pages in the interface (you may need to maximize the size of your screen). You can use these pages in the left hand pane to manage the resources in your workspace. Select the Compute page (under Manage).
-
On the Compute page, select the Compute clusters tab, and add a new compute cluster with the following settings. You’ll use this to train a machine learning model:
- Location: Select the same as your workspace. If that location is not listed, choose the one closest to you.
- Virtual machine tier: Dedicated
- Virtual machine type: CPU
- Virtual machine size:
- Choose Select from all options
- Search for and select Standard_DS11_v2
- Select Next
- Compute name: enter a unique name.
- Minimum number of nodes: 0
- Maximum number of nodes: 2
- Idle seconds before scale down: 120
- Enable SSH access: Clear
- Select Create
Note Compute instances and clusters are based on standard Azure virtual machine images. For this module, the Standard_DS11_v2 image is recommended to achieve the optimal balance of cost and performance. If your subscription has a quota that does not include this image, choose an alternative image; but bear in mind that a larger image may incur higher cost and a smaller image may not be sufficient to complete the tasks. Alternatively, ask your Azure administrator to extend your quota.
The compute cluster will take some time to be created. You can move onto the next step while you wait.
Create a pipeline and add a dataset
To get started with Azure Machine Learning designer, first you must create a pipeline.
-
In Azure Machine Learning studio, expand the left pane by selecting the menu icon at the top left of the screen. View the Designer page (under Authoring), and select + to create a new pipeline.
-
Change the draft name (Pipeline-Created-on-date) to Train Penguin Clustering.
In Azure Machine Learning, data for model training and other operations is usually encapsulated in an object called a dataset. In this module, you’ll use a dataset that includes observations of three species of penguin.
-
View the Data page (under Assets). The Data page contains specific data files or tables that you plan to work with in Azure ML.
- On the Data page, under the Data assets tab, select + Create. Then configure a data asset with the following settings:
- Data type:
- Name: penguin-data
- Description: Penguin data
- Dataset type: Tabular
- Data source: From Web Files
- Web URL:
- Web URL: https://aka.ms/penguin-data
- Skip data validation: do not select
- Settings:
- File format: Delimited
- Delimiter: Comma
- Encoding: UTF-8
- Column headers: Only first file has headers
- Skip rows: None
- Dataset contains multi-line data: do not select
- Schema:
- Include all columns other than Path
- Review the automatically detected types
- Review
- Select Create
- Data type:
- After the dataset has been created, open it and view the Explore page to see a sample of the data. This data represents measurements of the culmen (bill) length and depth, flipper length, and body mass for multiple observations of penguins. There are three species of penguin represented in the dataset: Adelie, Gentoo, and Chinstrap.
Note The penguins dataset used in the this exercise is a subset of data collected and made available by Dr. Kristen Gorman and the Palmer Station, Antarctica LTER, a member of the Long Term Ecological Research Network.
Load data to canvas
-
Return to your pipeline by selecting Designer on the left-hand menu. On the Designer page, select the Train Penguin Clustering pipeline draft.
-
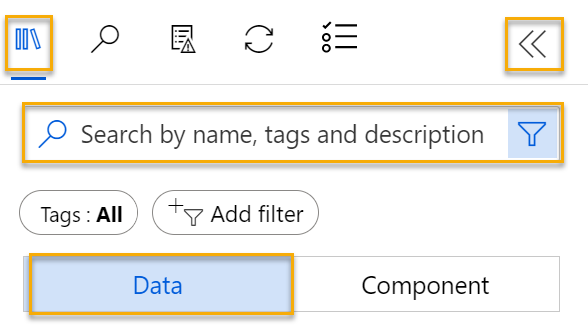
Next to the pipeline name on the left, select the arrows icon to expand the panel if it is not already expanded. The panel should open by default to the Asset library pane, indicated by the books icon at the top of the panel. Note that there is a search bar to locate assets. Notice two buttons, Data and Component.
-
Select Data, search for and place the penguin-data dataset onto the canvas.
-
Right-click (Ctrl+click on a Mac) the penguin-data dataset on the canvas, and click on Preview data.
-
Select the Profile tab, noting that you can see the distributions of the various columns as histograms.
-
Note the following characteristics of the dataset:
- The dataset includes the following columns:
- CulmenLength: Length of the penguin’s bill in millimeters.
- CulmenDepth: Depth of the penguin’s bill in millimeters.
- FlipperLength: Length of the penguin’s flipper in millimeters.
- BodyMass: Weight of the penguin in grams.
- Species: Species indicator (0:”Adelie”, 1:”Gentoo”, 2:”Chinstrap”)
- There are two missing values in the CulmenLength column (the CulmenDepth, FlipperLength, and BodyMass columns also have two missing values).
- The measurement values are in different scales (from tens of millimeters to thousands of grams).
- The dataset includes the following columns:
-
Close the DataOutput page so you can see the dataset on the pipeline canvas.
Apply transformations
-
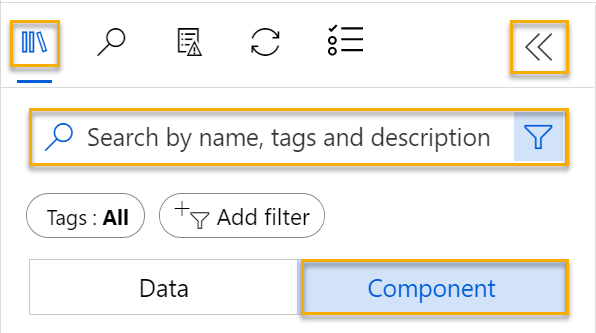
In the Asset library pane on the left, select Component ( which contains a wide range of modules you can use for data transformation and model training). You can also use the search bar to quickly locate modules.
-
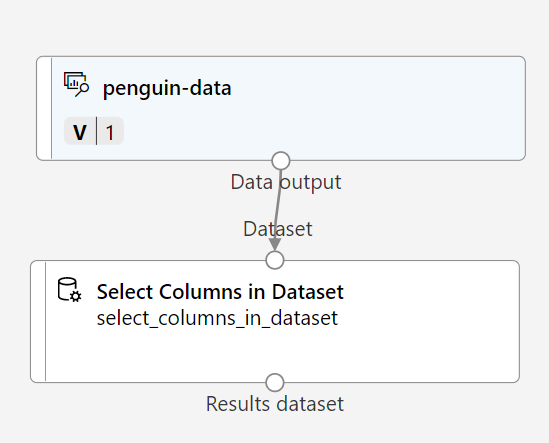
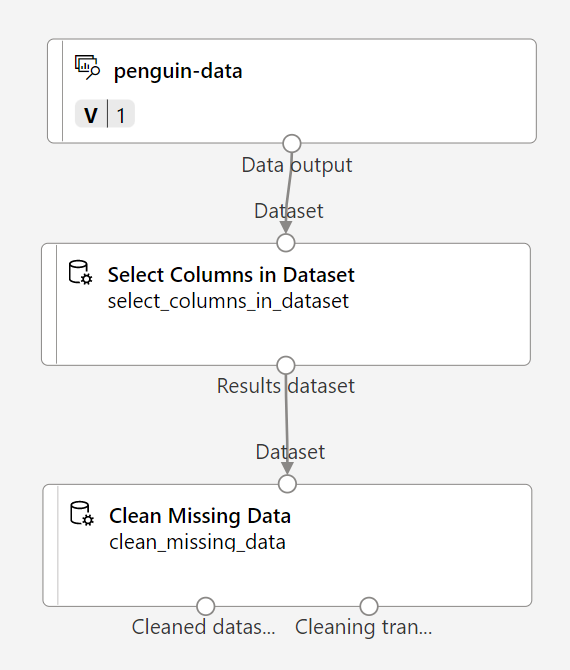
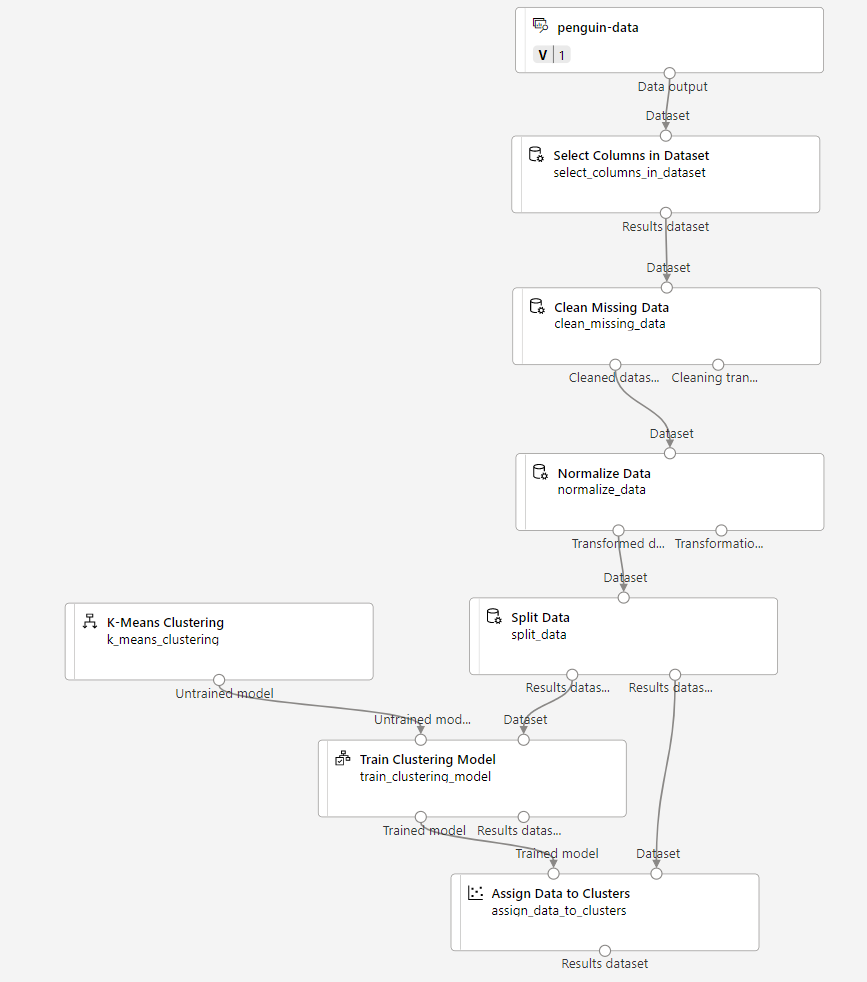
To cluster the penguin observations, we’re going to use only the measurements - we’ll ignore the species column. So, search for a Select Columns in Dataset module and place it on the canvas, below the penguin-data module and connect the output at the bottom of the penguin-data module to the input at the top of the Select Columns in Dataset module, like this:
-
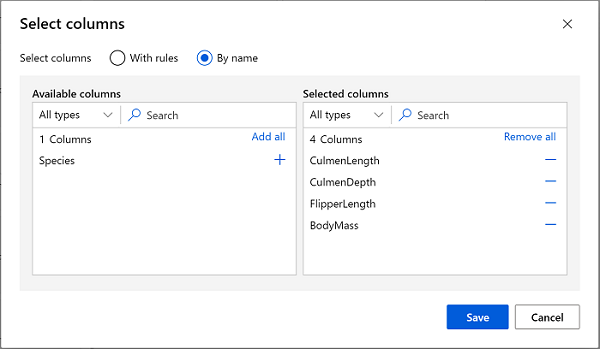
Double click on the Select Columns in Dataset module, and in the pane on the right, select Edit column. Then in the Select columns window, select By name and use the + links to select the column names CulmenLength, CulmenDepth, FlipperLength, and BodyMass; like this:
-
Select Save, then close the Select Columns in Dataset menu to return to the designer canvas.
-
In the Asset library, search for a Clean Missing Data module and place it onto the canvas, below the Select columns in dataset module and connect them like this:
-
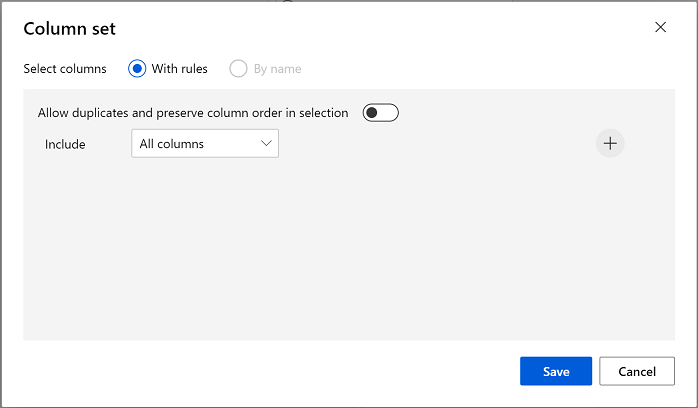
Double click the Clean Missing Data module, and in the settings pane on the right, select Edit column. Then in the Columns to be cleaned window, select With rules and include All columns; like this:
- Select Save , then, in the settings pane, set the following configuration settings:
- Minimum missing value ratio: 0.0
- Maximum missing value ratio: 1.0
- Cleaning mode: Remove entire row
-
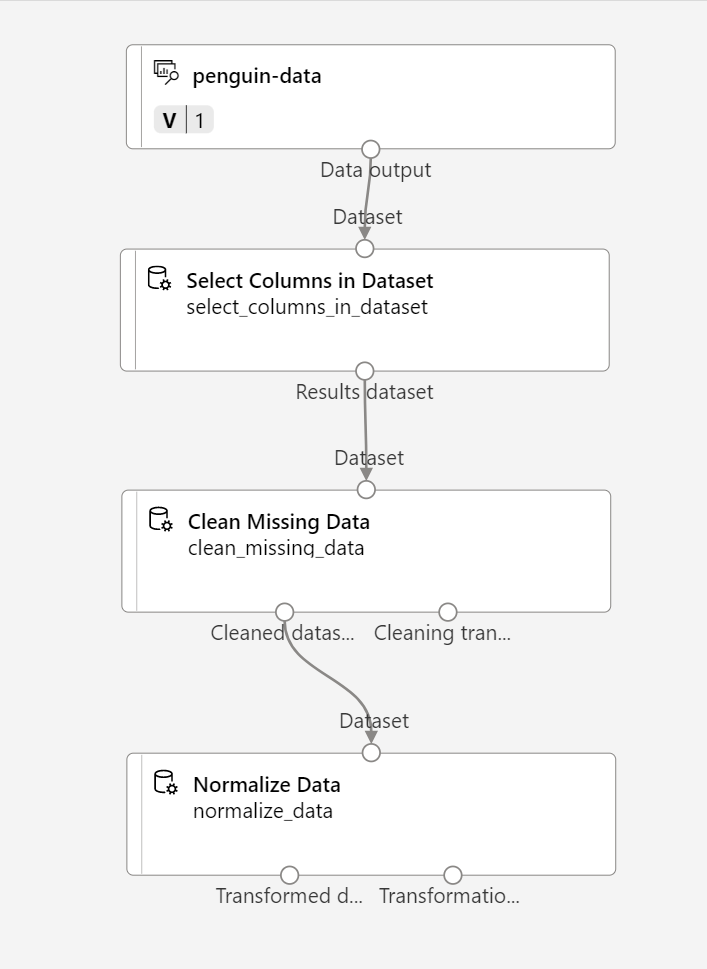
In the Asset library, search for a Normalize Data module and place it to the canvas, below the Clean Missing Data module. Then connect the left-most output from the Clean Missing Data module to the input of the Normalize Data module.
-
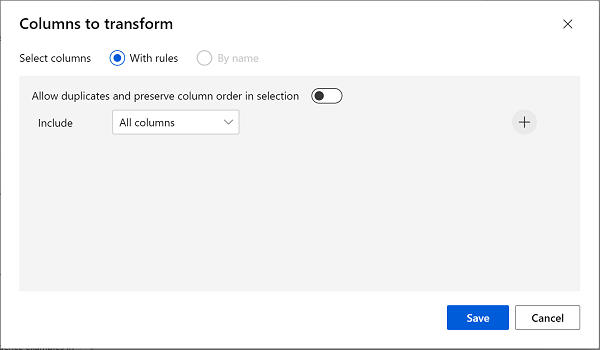
Double click the Normalize Data module, and in the pane on the right, set the Transformation method to MinMax and select Edit column. Then in the Columns to transform window, select With rules and include All columns; like this:
- Select Save ,then close the Normalize Data module settings to return to the designer canvas.
Run the pipeline
To apply your data transformations, you need to run the pipeline as an experiment.
-
Select Configure & Submit at the top of the page to open the Set up pipeline job dialogue.
-
On the Basics page select Create new and set the name of the experiment to mslearn-penguin-training then select Next .
-
On the Inputs & outputs page select Next without making any changes.
-
On the Runtime settings page an error appears as you don´t have a default compute to run the pipeline. In the Select compute type drop-down select Compute cluster and in the Select Azure ML compute cluster drop-down select your recently created compute cluster.
-
Select Next to review the pipeline job and then select Submit to run the training pipeline.
-
Wait for the run to finish. This may take 5 minutes or more. You can check the status of the job by selecting Jobs under the Assets. From there, select the Train Penguin Clustering job.
View the transformed data
-
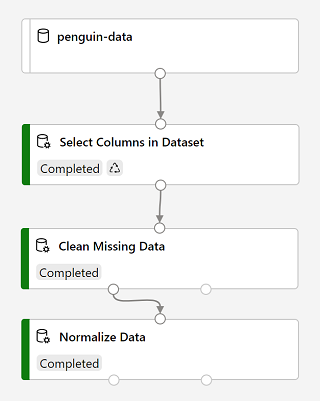
When the run has completed, the modules will look like this:
-
Right click on the Normalize Data module, select Preview data, then select Transformed dataset to view the results.
-
View the data, noting that the Species column has been removed, there are no missing values, and the values for all four features have been normalized to a common scale.
-
Close the Transformed_dataset page to return to the pipeline run.
Now that you have selected and prepared the features you want to use from the dataset, you’re ready to use them to train a clustering model.
After you’ve used data transformations to prepare the data, you can use it to train a machine learning model.
Add training modules
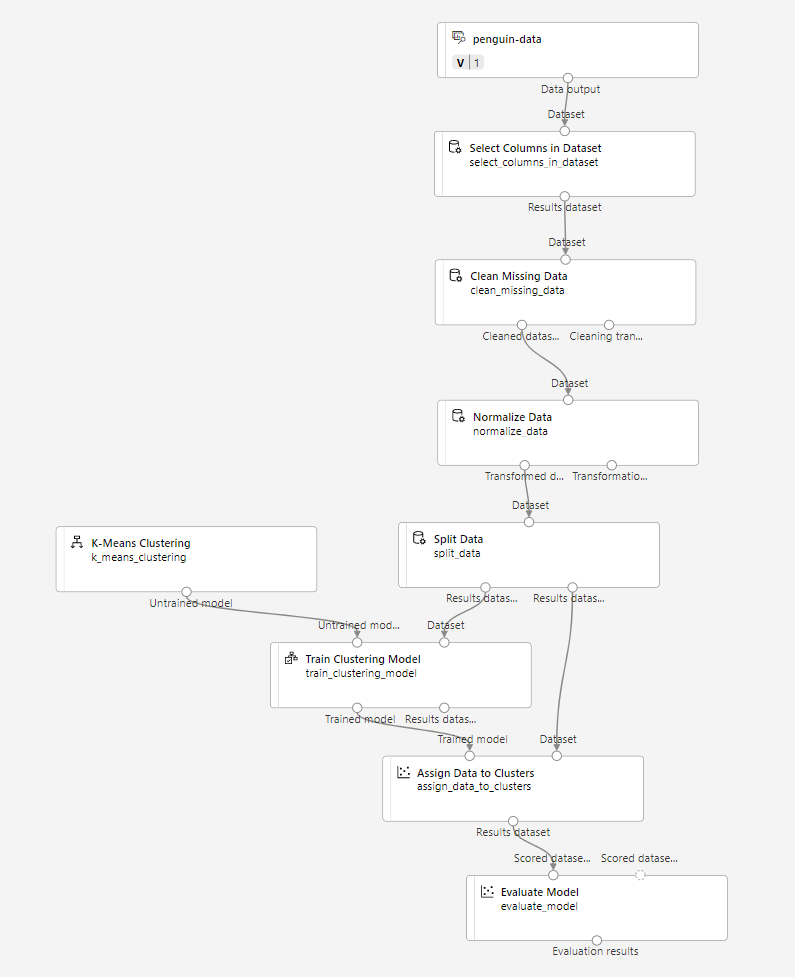
Work through the following steps to extend the Train Penguin Clustering pipeline as shown here:
Follow the steps below, using the image above for reference as you add and configure the required modules.
-
Return to the Designer page and open the Train Penguin Clustering pipeline draft.
-
In the Asset library pane on the left, search for and place a Split Data module onto the canvas under the Normalize Data module. Then connect the left output of the Normalize Data module to the input of the Split Data module.
Tip Use the search bar to quickly locate modules.
- Select the Split Data module, and configure its settings as follows:
- Splitting mode: Split Rows
- Fraction of rows in the first output dataset: 0.7
- Randomized split: True
- Random seed: 123
- Stratified split: False
-
In the Asset library, search for and place a Train Clustering Model module to the canvas, under the Split Data module. Then connect the Results dataset1 (left) output of the Split Data module to the Dataset (right) input of the Train Clustering Model module.
-
The clustering model should assign clusters to the data items by using all of the features you selected from the original dataset. Double click the Train Clustering Model module and in the right hand pane, select Edit column. Use the With rules option to include all columns; like this:
-
The model we’re training will use the features to group the data into clusters, so we need to train the model using a clustering algorithm. In the Asset library, search for and place a K-Means Clustering module to the canvas, to the left of the Split data module and above the Train Clustering Model module. Then connect its output to the Untrained model (left) input of the Train Clustering Model module.
-
The K-Means algorithm groups items into the number of clusters you specify - a value referred to as K. Select the K-Means Clustering module and in the right hand pane, set the Number of centroids parameter to 3.
Note You can think of data observations, like the penguin measurements, as being multidimensional vectors. The K-Means algorithm works by:
- initializing K coordinates as randomly selected points called centroids in n-dimensional space (where n is the number of dimensions in the feature vectors).
- Plotting the feature vectors as points in the same space, and assigning each point to its closest centroid.
- Moving the centroids to the middle of the points allocated to it (based on the mean distance).
- Reassigning the points to their closest centroid after the move.
- Repeating steps c. and d. until the cluster allocations stabilize or the specified number of iterations has completed.
After using 70% of the data to train the clustering model, you can use the remaining 30% to test it by using the model to assign the data to clusters.
- In the Asset library, search for and place an Assign Data to Clusters module to the canvas, below the Train Clustering Model module. Then connect the Trained model (left) output of the Train Clustering Model module to the Trained model (left) input of the Assign Data to Clusters module; and connect the Results dataset2 (right) output of the Split Data module to the Dataset (right) input of the Assign Data to Clusters module.
Run the training pipeline
Now you’re ready to run the training pipeline and train the model.
-
Ensure your pipeline looks like this:
-
Select Configure & Submit, and run the pipeline using the existing experiment named mslearn-penguin-training on your compute cluster.
-
Wait for the run to finish. This may take 5 minutes or more. Check the status of the job by selecting Jobs under the Assets. From there, select the latest Train Penguin Clustering job.
-
When the experiment run has finished, right click on the Assign Data to Clusters module, select Preview data and then select Results dataset to view the results.
-
Scroll down, and note the Assignments column, which contains the cluster (0, 1, or 2) to which each row is assigned. There are also new columns indicating the distance from the point representing this row to the centers of each of the clusters - the cluster to which the point is closest is the one to which it is assigned.
-
Close the Results_dataset visualization to return to the pipeline run.
The model is predicting clusters for the penguin observations, but how reliable are its predictions? To assess that, you need to evaluate the model.
Evaluating a clustering model is made difficult by the fact that there are no previously known true values for the cluster assignments. A successful clustering model is one that achieves a good level of separation between the items in each cluster, so we need metrics to help us measure that separation.
Add an Evaluate Model module
-
On the Designer page, open the Train Penguin Clustering pipeline draft.
-
In the Asset library, search for and place an Evaluate Model module on the canvas, under the Assign Data to Clusters module. Connect the output of the Assign Data to Clusters module to the Scored dataset (left) input of the Evaluate Model module.
-
Ensure your pipeline looks like this:
-
Select Configure & Submit, and run the pipeline using the existing experiment named mslearn-penguin-training on your compute cluster.
-
Wait for the experiment run to finish. To check its status, go to the Jobs page and select the latest Train Penguin Clustering job.
- Right click on the Evaluate Model module, select Preview data, then select Evaluation results. Review the metrics in each row:
- Average Distance to Other Center
- Average Distance to Cluster Center
- Number of Points
- Maximal Distance to Cluster Center
- Close the Evaluation_results tab.
Now that you have a working clustering model, you can use it to assign new data to clusters in an inference pipeline.
After creating and running a pipeline to train the clustering model, you can create an inference pipeline. The inference pipeline uses the model to assign new data observations to clusters. This model will form the basis for a predictive service that you can publish for applications to use.
Create an inference pipeline
-
Locate the menu above the canvas and select Create inference pipeline. You may need to expand your screen to full and click on the … icon on the top right hand corner of the screen in order to find Create inference pipeline in the menu.

-
In the Create inference pipeline drop-down list select Real-time inference pipeline. After a few seconds, a new version of your pipeline named Train Penguin Clustering-real time inference will be opened.
-
Rename the new pipeline to Predict Penguin Clusters, and then review the new pipeline. The transformations and clustering model in your training pipeline are a part of this pipeline. The trained model will be used to score the new data. The pipeline also contains a web service output to return results.
You’re going to make the following changes to the inference pipeline:
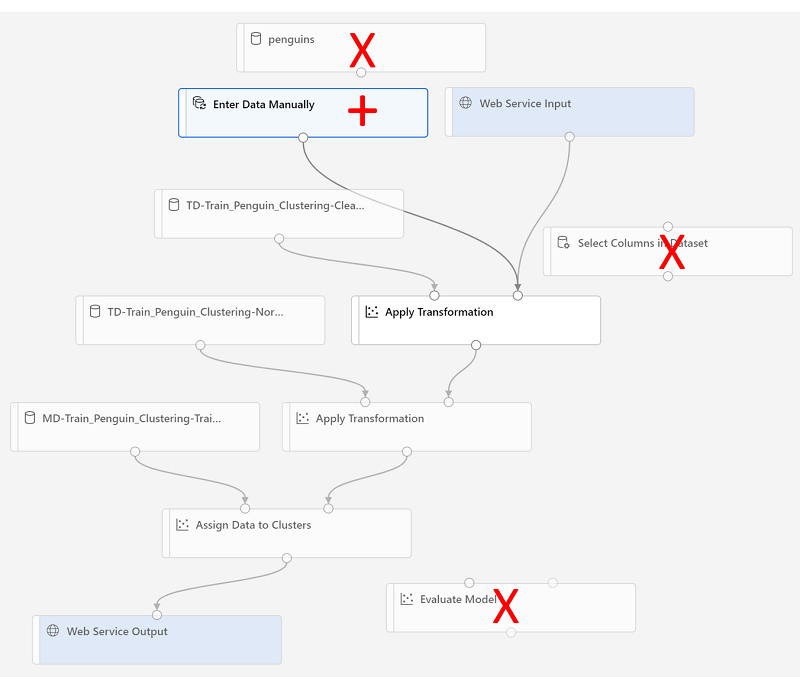
- Add a web service input component for new data to be submitted.
- Replace the penguin-data dataset with an Enter Data Manually component that doesn’t include the Species column.
- Remove the Select Columns in Dataset component, which is now redundant.
- Connect the Web Service Input and Enter Data Manually components (which represent inputs for data to be clustered) to the first Apply Transformation component.
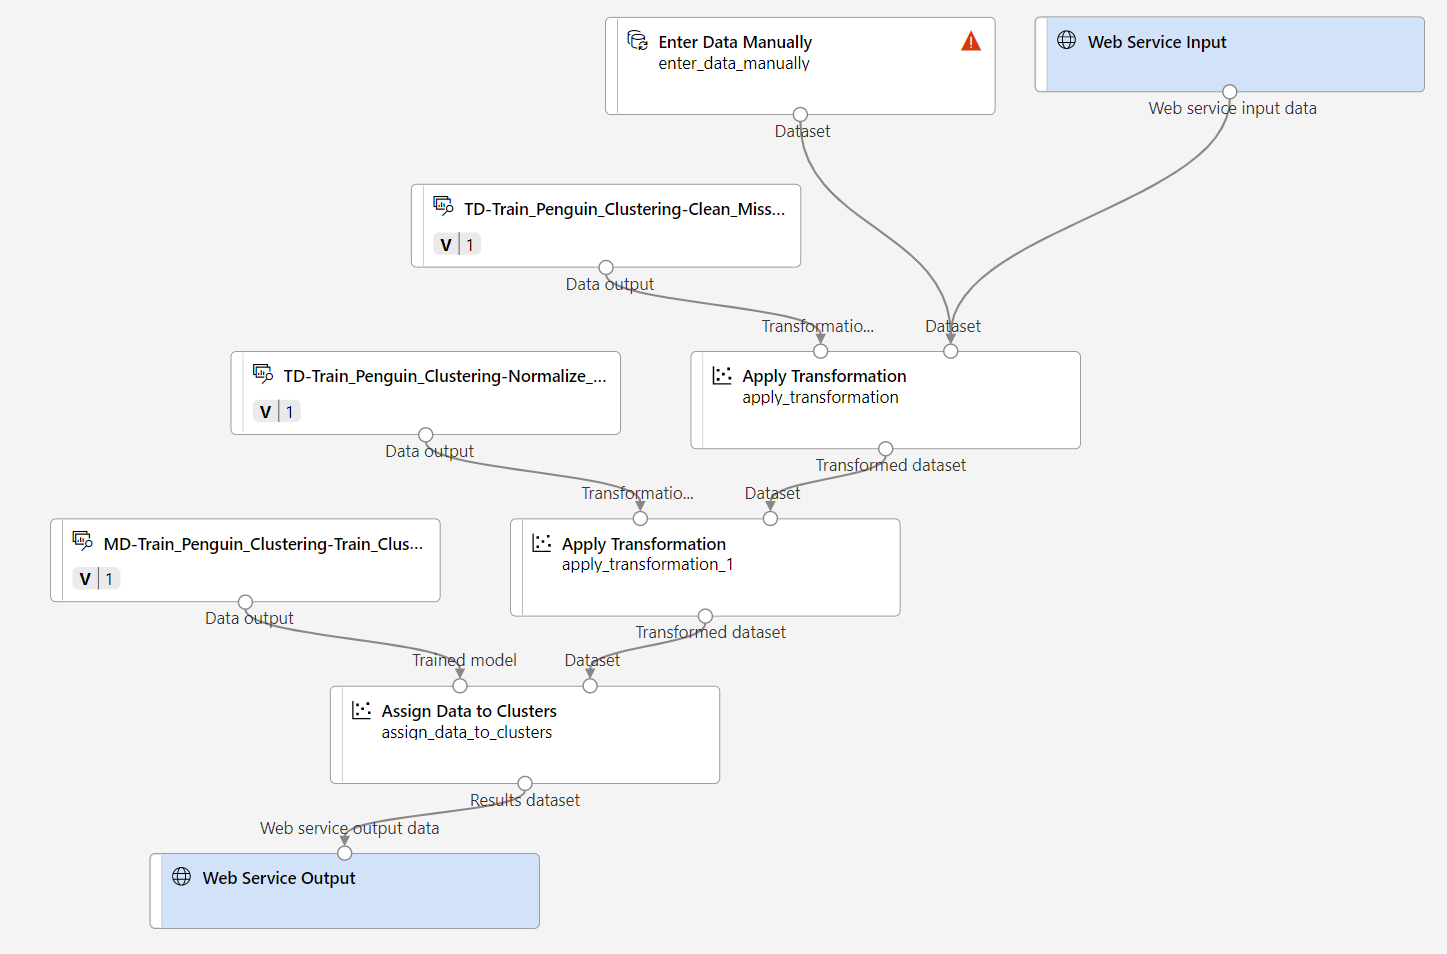
Follow the remaining steps below, using the image and information above for reference as you modify the pipeline.
-
The pipeline does not automatically include a Web Service Input component for models created from custom data sets. Search for a Web Service Input component from the asset library and place it at the top of the pipeline. Connect the output of the Web Service Input component to the Dataset (right) input of the first Apply Transformation component that is already on the canvas.
-
The inference pipeline assumes that new data will match the schema of the original training data, so the penguin-data dataset from the training pipeline is included. However, this input data includes a column for the penguin species, which the model does not use. Delete both the penguin-data dataset and the Select Columns in Dataset modules, and replace them with an Enter Data Manually module from the Asset library.
-
Then modify the settings of the Enter Data Manually module to use the following CSV input, which contains feature values for three new penguin observations (including headers):
CulmenLength,CulmenDepth,FlipperLength,BodyMass 39.1,18.7,181,3750 49.1,14.8,220,5150 46.6,17.8,193,3800 -
Connect the output of the Enter Data Manually module to the Dataset (right) input of the first Apply Transformation module.
-
Delete the Evaluate Model module.
-
Verify that your pipeline looks similar to the following image:
-
Submit the pipeline as a new experiment named mslearn-penguin-inference on your compute cluster. The experiment may take a while to run.
-
Go to Jobs and select the latest Predict Penguin Clusters job with the mslearn-penguin-inference experiment name.
-
When the pipeline has finished, right click on Assign Data to Clusters module, select Preview data and select Results dataset to see the predicted cluster assignments and metrics for the three penguin observations in the input data.
Your inference pipeline assigns penguin observations to clusters based on their features. Now you’re ready to publish the pipeline so that client applications can use it.
Deploy a service
In this exercise, you’ll deploy the web service to to an Azure Container Instance (ACI). This type of compute is created dynamically, and is useful for development and testing. For production, you should create an inference cluster, which provide an Azure Kubernetes Service (AKS) cluster that provides better scalability and security.
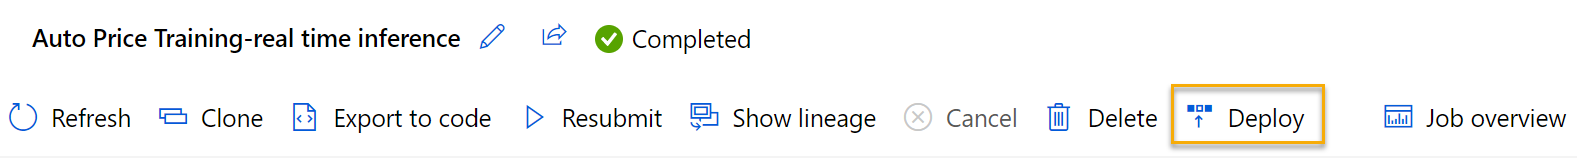
-
While on the Predict Penguin Clusters inference run page, select Deploy on the top menu bar.
- Select Deploy a new real-time endpoint and use the following settings:
- Name: predict-penguin-clusters
- Description: Cluster penguins.
- Compute type: Azure Container Instance
-
Wait for the web service to be deployed - this can take several minutes.
- To view the deployment status, expand the left pane by selecting the menu icon at the top left of the screen. View the Endpoints page (under Assets) and select predict-penguin-clusters. When the deployment has finished, the Deployment state will change to Healthy.
Test the service
-
On the Endpoints page, open the predict-penguin-clusters real-time endpoint, and select the Test tab.
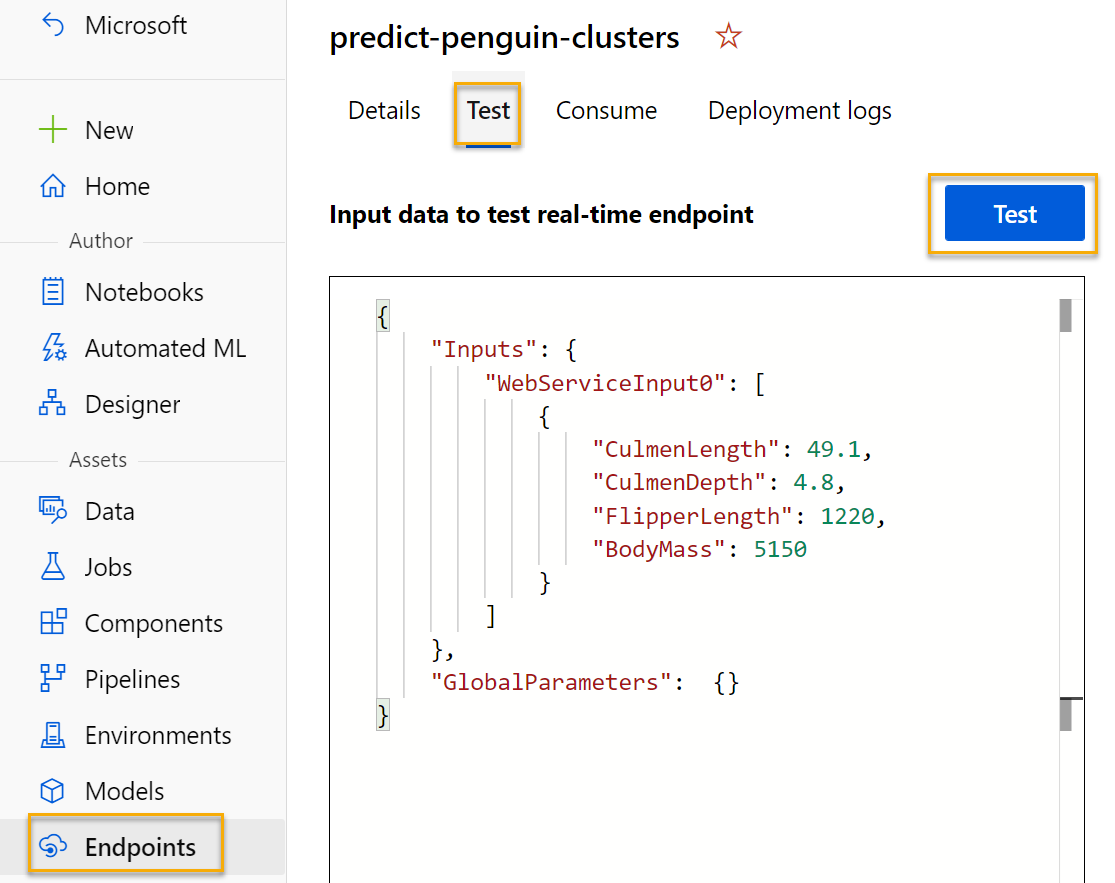
-
We will use it to test our model with new data. Delete the current data under Input data to test real-time endpoint. Copy and paste the below data into the data section:
 {
     "Inputs": {
         "input1": [
             {
                 "CulmenLength": 49.1,
                 "CulmenDepth": 4.8,
                 "FlipperLength": 1220,
                 "BodyMass": 5150
             }
         ]
     },
     "GlobalParameters":  {}
 }
Note The JSON above defines features for a penguin, and uses the predict-penguin-clusters service you created to predict a cluster assignment.
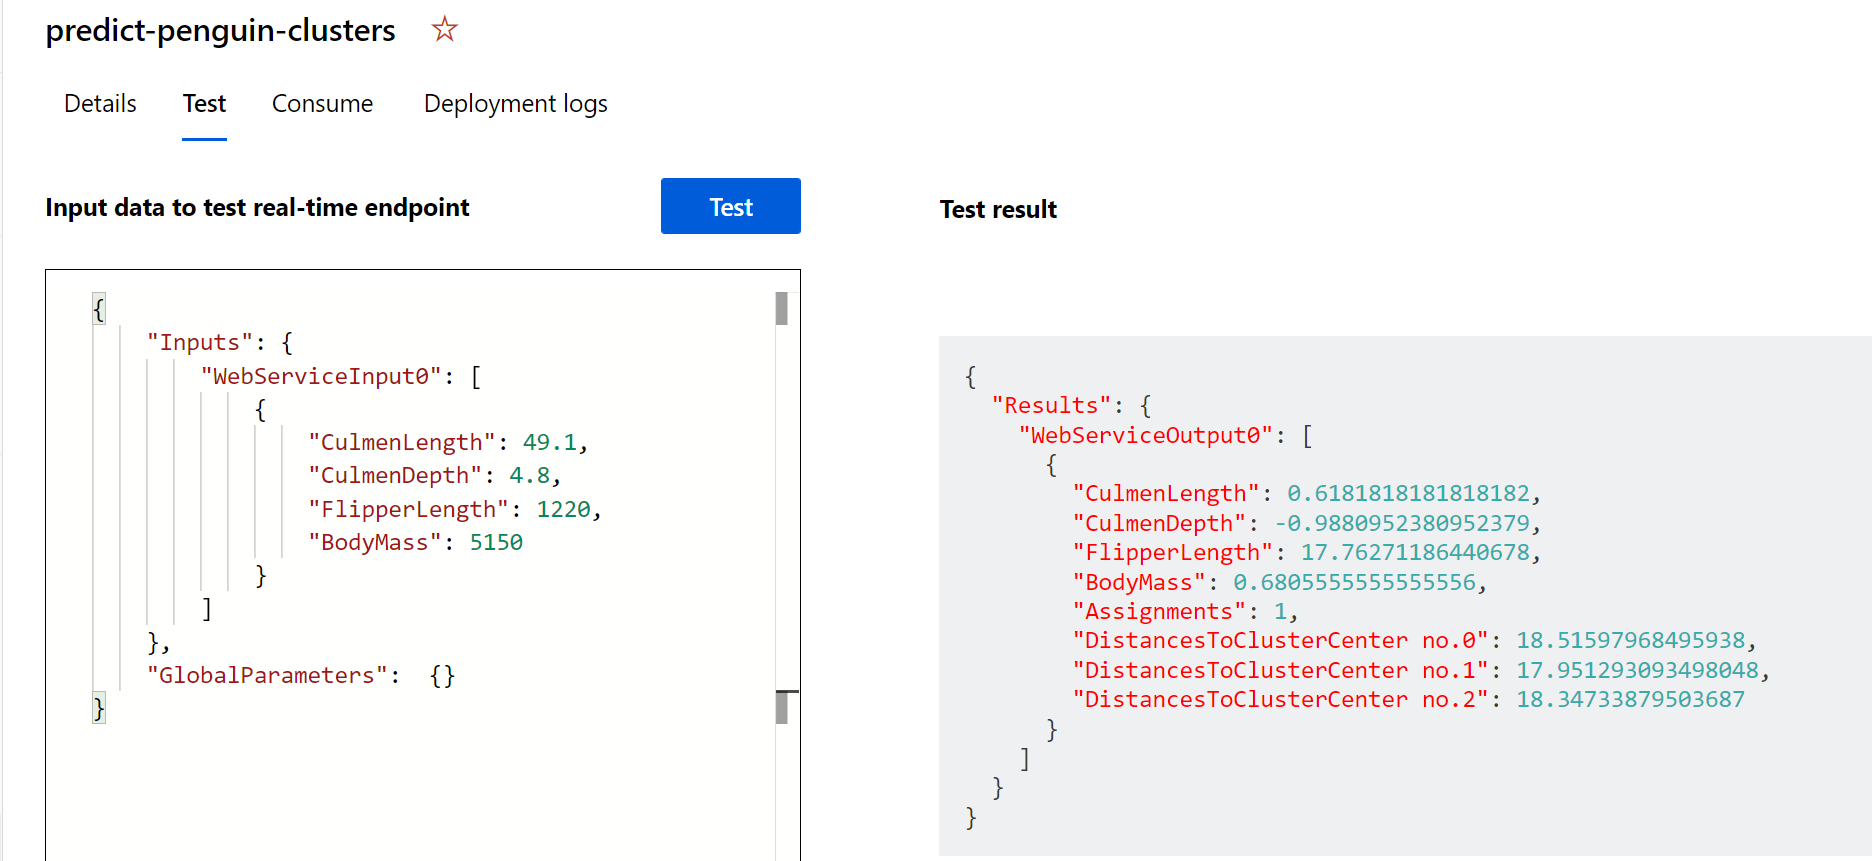
-
Select Test. On the right hand of the screen, you should see the output ‘Assignments’. Notice how the assigned cluster is the one with the shortest distance to cluster center.
You have just tested a service that is ready to be connected to a client application using the credentials in the Consume tab. We will end the lab here. You are welcome to continue to experiment with the service you just deployed.
Clean-up
The web service you created is hosted in an Azure Container Instance. If you don’t intend to experiment with it further, you should delete the endpoint to avoid accruing unnecessary Azure usage. You should also delete the compute cluster.
-
In Azure Machine Learning studio, on the Endpoints tab, select the predict-penguin-clusters endpoint. Then select Delete (🗑) and confirm that you want to delete the endpoint.
-
On the Compute page, on the Compute clusters tab, select your compute cluster and then select Delete.
Note Deleting your compute ensures your subscription won’t be charged for compute resources. You will however be charged a small amount for data storage as long as the Azure Machine Learning workspace exists in your subscription. If you have finished exploring Azure Machine Learning, you can delete the Azure Machine Learning workspace and associated resources. However, if you plan to complete any other labs in this series, you will need to recreate it.
To delete your workspace:
- In the Azure portal, in the Resource groups page, open the resource group you specified when creating your Azure Machine Learning workspace.
- Click Delete resource group, type the resource group name to confirm you want to delete it, and select Delete.